Office Space
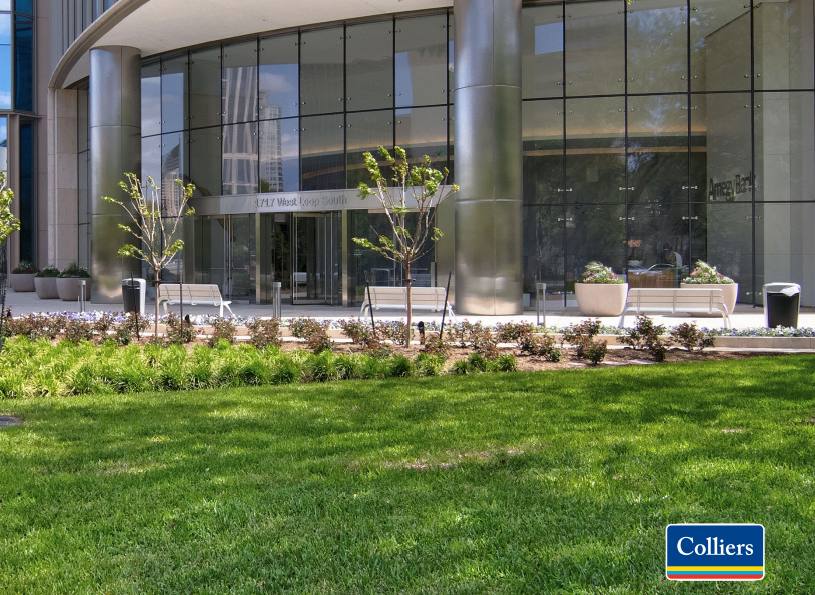
1717 West Loop South Houston, TX 77027
1717 West Loop South Houston, TX 77027
Details & Description
Property Highlights
- • Efficient Floor Plans
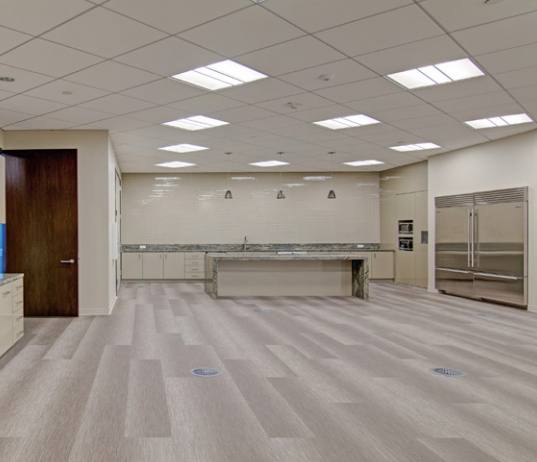
- • Full service cafeteria
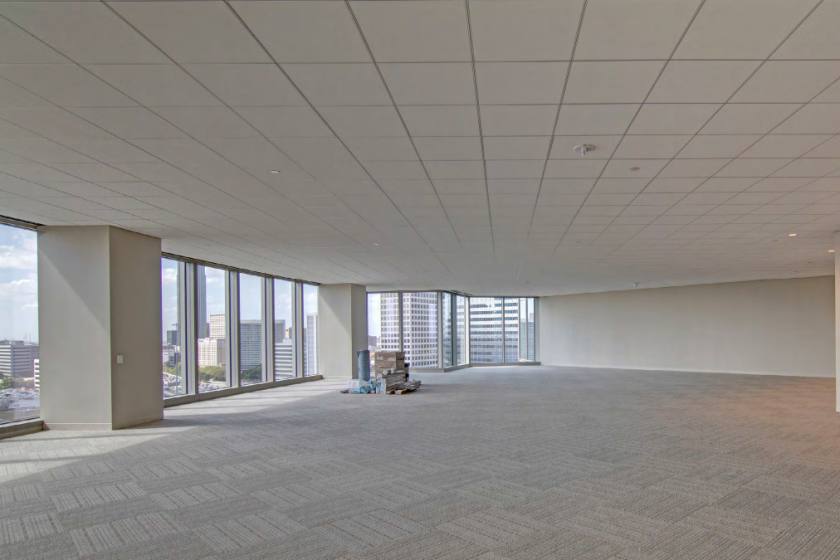
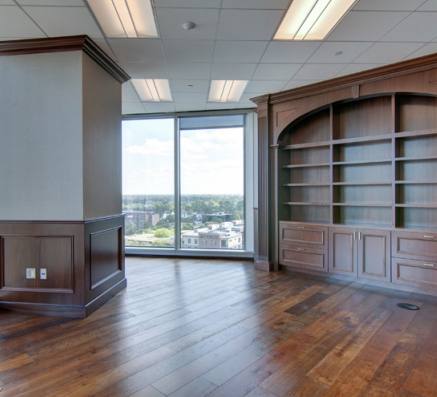
- • Excellent Views (Podium style -building)
- • Prominent West Loop address
- • Under floor HVAC
- • LEED Certified Gold Design
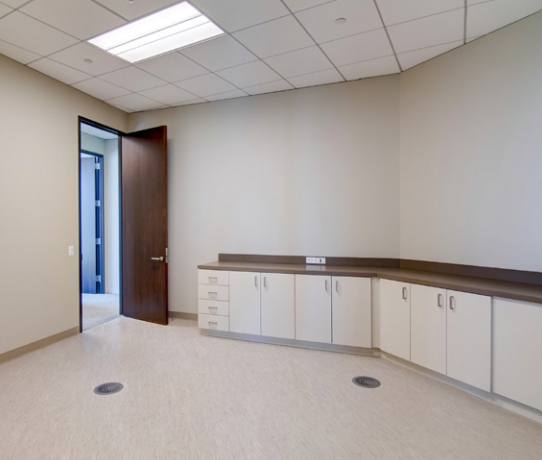
Additional Photos

Listing Agents

Jay Kyle
O: 713-830-2138
M: 832-689-5953
jay.kyle@colliers.com
O: 713-830-2138
M: 832-689-5953
jay.kyle@colliers.com

Chris Nash
O: 713-830-2153
M: 713-213-1306
chris.nash@colliers.com
O: 713-830-2153
M: 713-213-1306
chris.nash@colliers.com
While we strive to provide the most accurate information, all listing information, and demographic data, is provided by third-parties. As such, MyEListing will not be responsible for the accuracy of the information. It is strongly recommended that you verify all information with the listing agent, and any relevant agencies, prior to making any decisions.