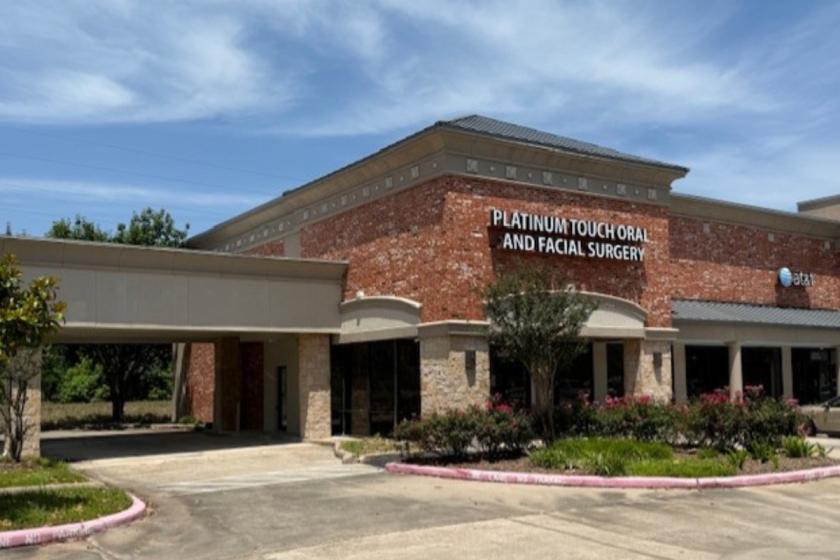
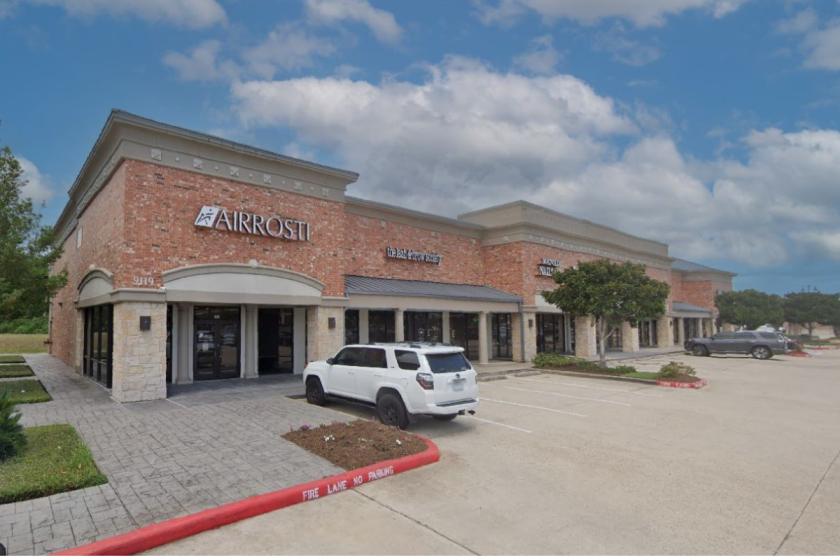
Retail Space
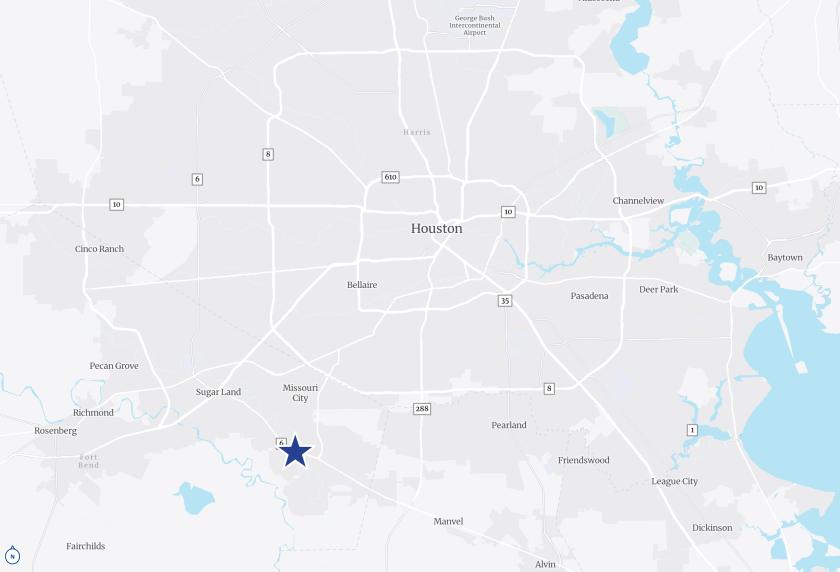
9029 Highway 6 Missouri City, TX 77459
9029 Highway 6 Missouri City, TX 77459

Details & Description
Property Highlights
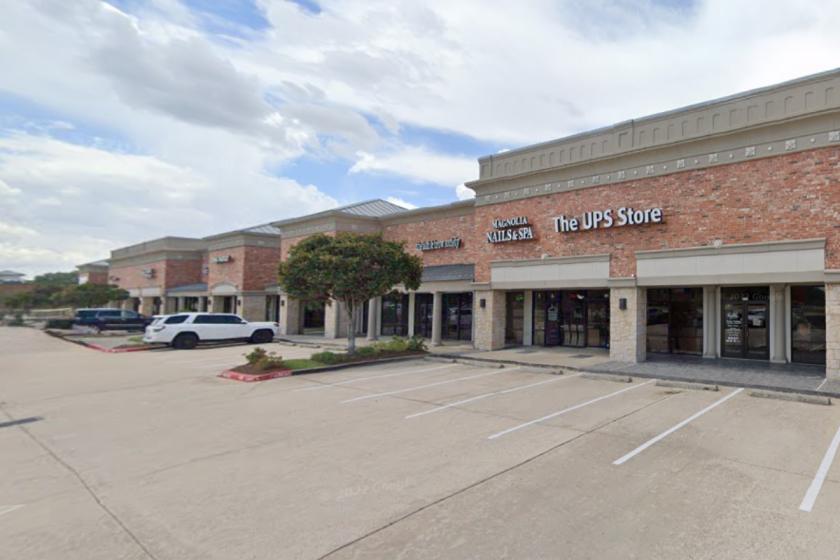
- • One retail lease space currently available
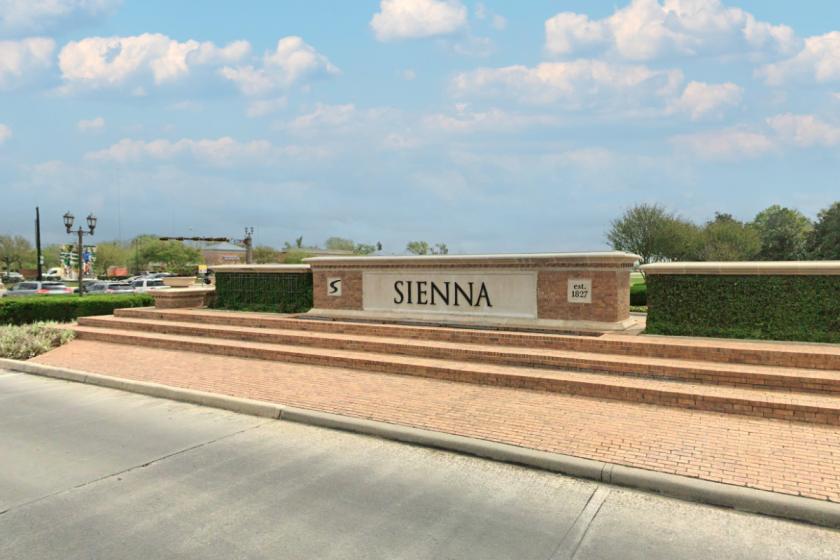
- • Great area demographics; high traffic counts
- • Easy access to Fort Bend Parkway Toll Road
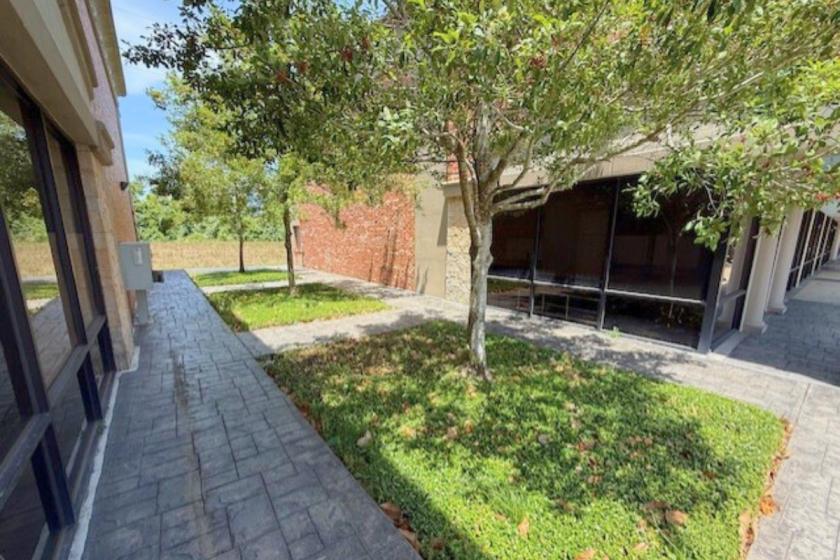
- • Well-maintained property
- • Quality regional tenant mix
- • Consistently over 90% occupied
Additional Photos
Listing Agents

Kolbe Curtice
O: 281-269-3441
M: 281-802-2260
kolbe.curtice@colliers.com
O: 281-269-3441
M: 281-802-2260
kolbe.curtice@colliers.com
While we strive to provide the most accurate information, all listing information, and demographic data, is provided by third-parties. As such, MyEListing will not be responsible for the accuracy of the information. It is strongly recommended that you verify all information with the listing agent, and any relevant agencies, prior to making any decisions.