Industrial Properties
12560 Reed Road Sugar Land, TX 77478
12560 Reed Road Sugar Land, TX 77478
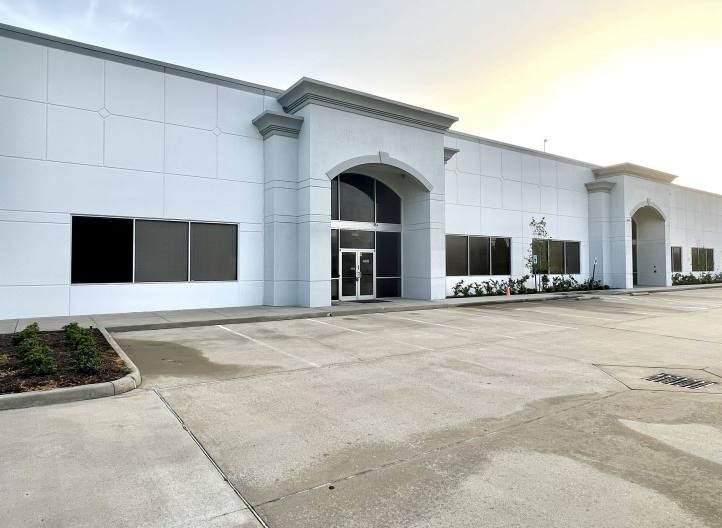
Details & Description
Property Highlights
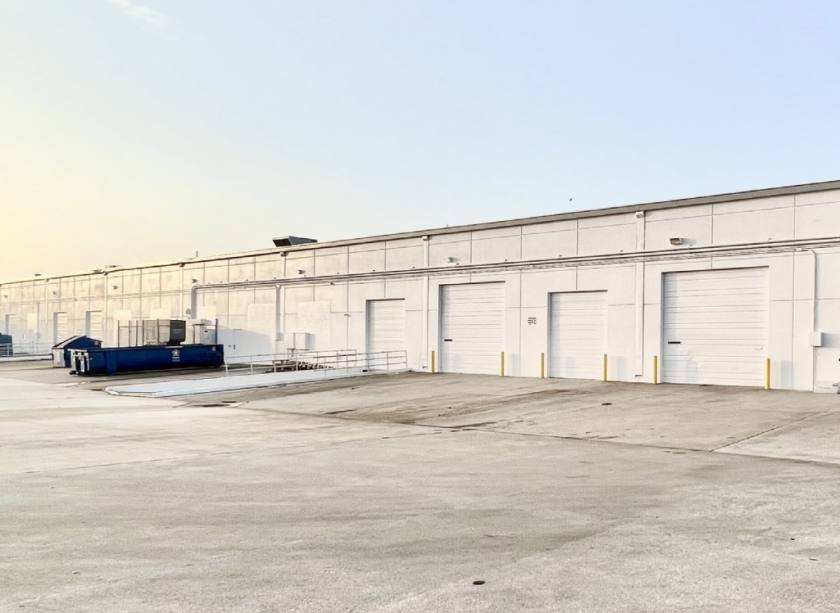
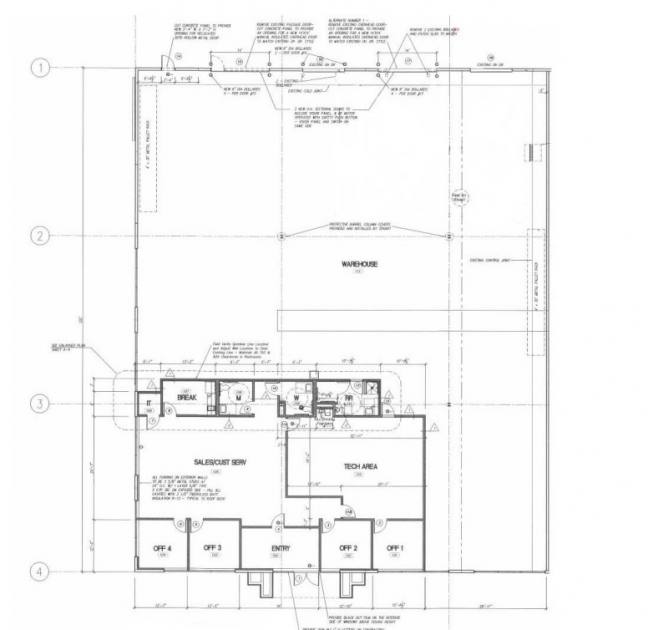
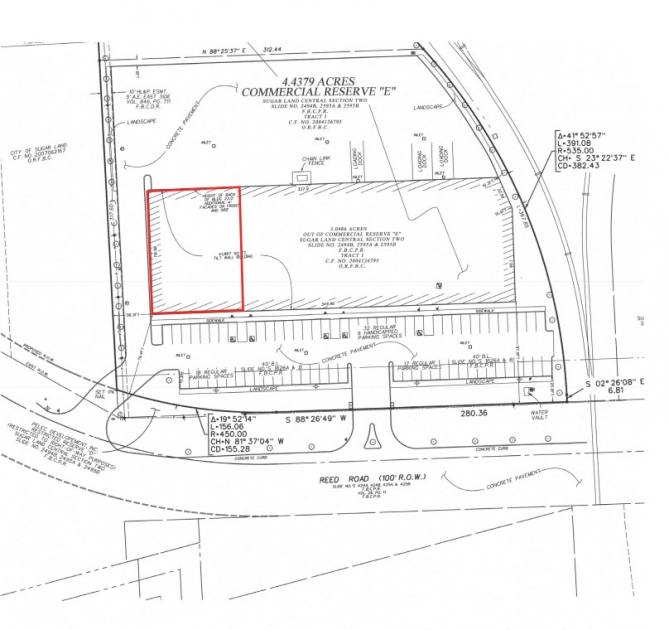
- • Building Size: 42,000 SF; Lot Size: 4.44 Acres
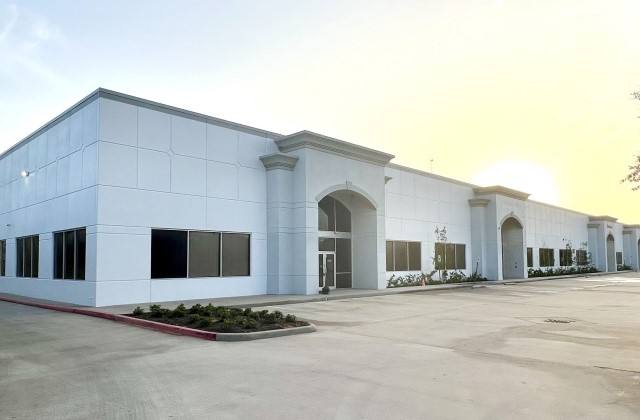
- • Construction: Tiltwall
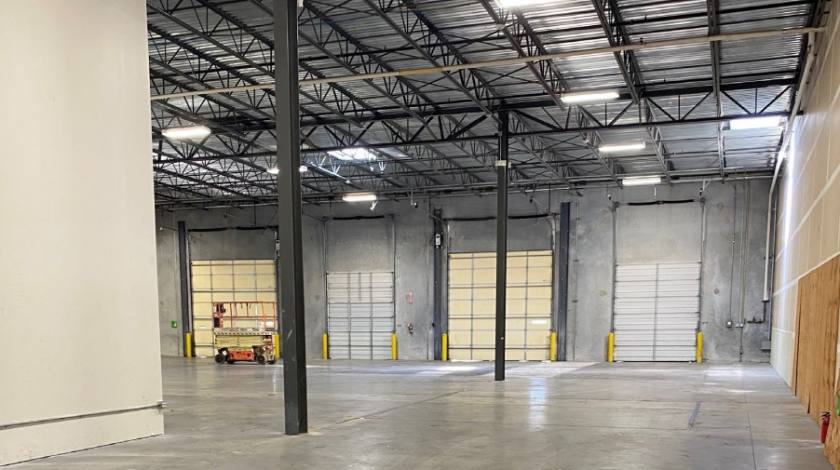
- • Clearance Height: 22'; Fully sprinklered
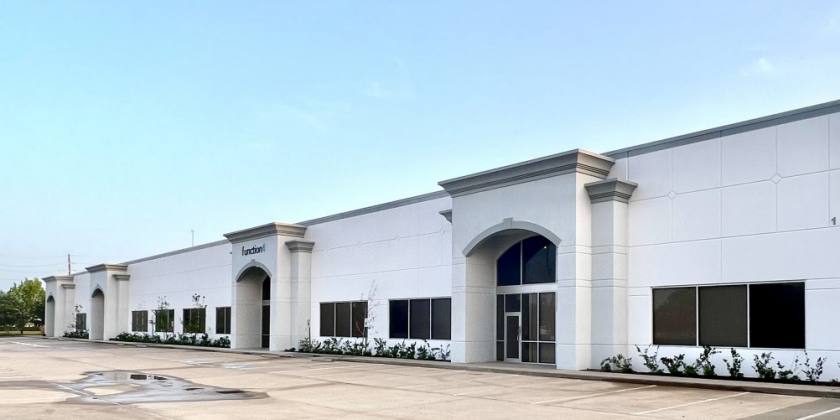
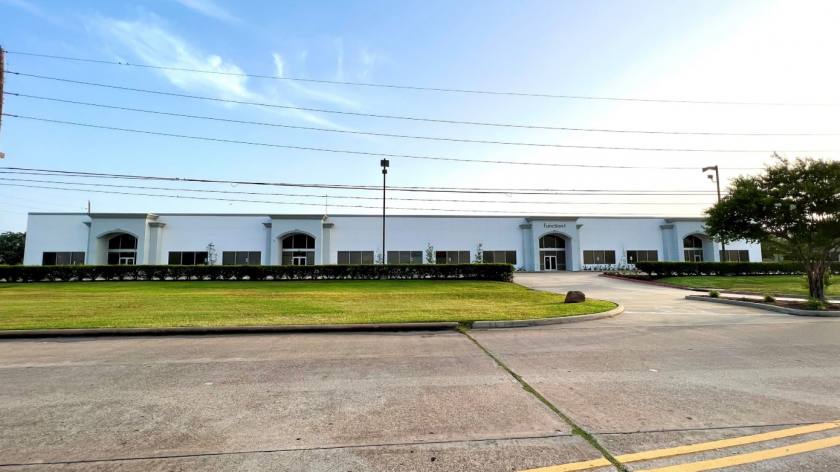
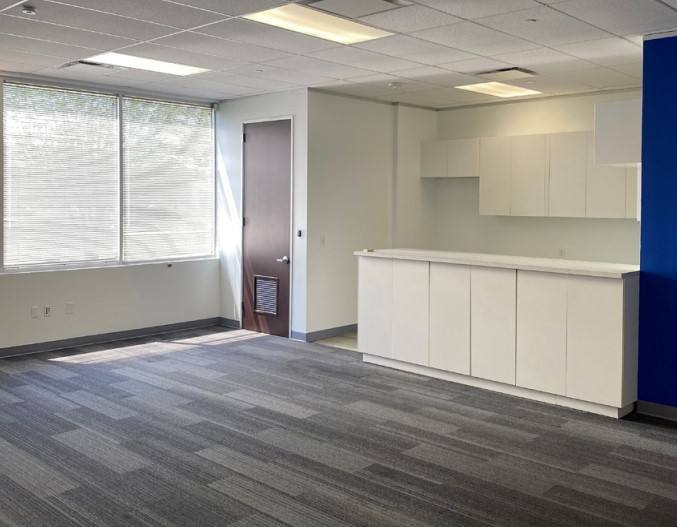
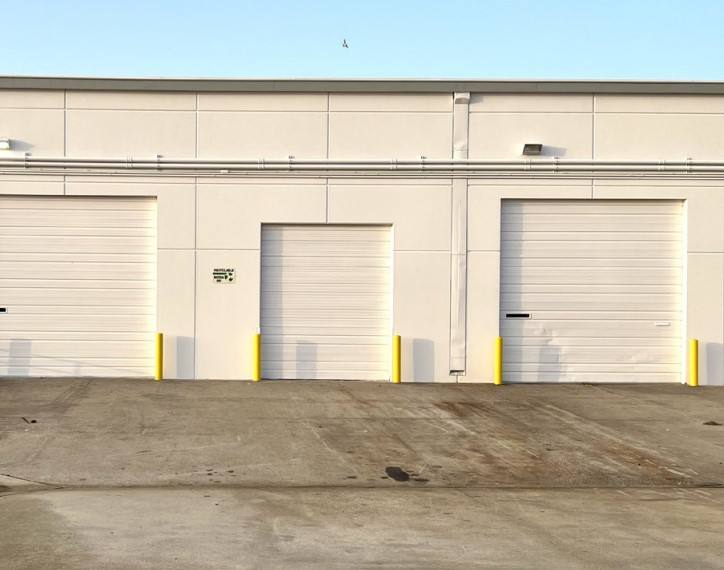
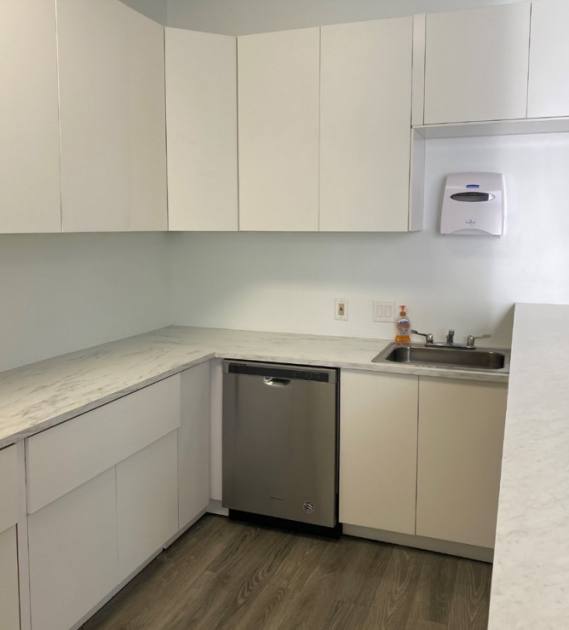
Additional Photos

Listing Agents

Jim Pratt
O: 713-830-2147
M: 713-201-9062
jim.pratt@colliers.com
O: 713-830-2147
M: 713-201-9062
jim.pratt@colliers.com
While we strive to provide the most accurate information, all listing information, and demographic data, is provided by third-parties. As such, MyEListing will not be responsible for the accuracy of the information. It is strongly recommended that you verify all information with the listing agent, and any relevant agencies, prior to making any decisions.