Office Space
16525 Lexington Boulevard Sugar Land, TX 77479
16525 Lexington Boulevard Sugar Land, TX 77479
Details & Description
Property Highlights
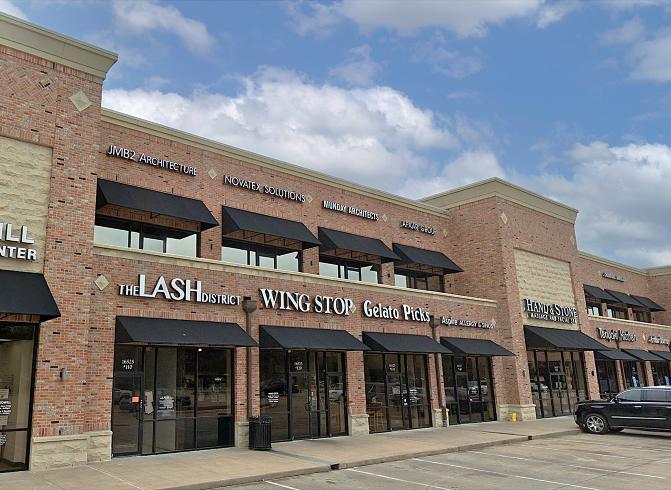
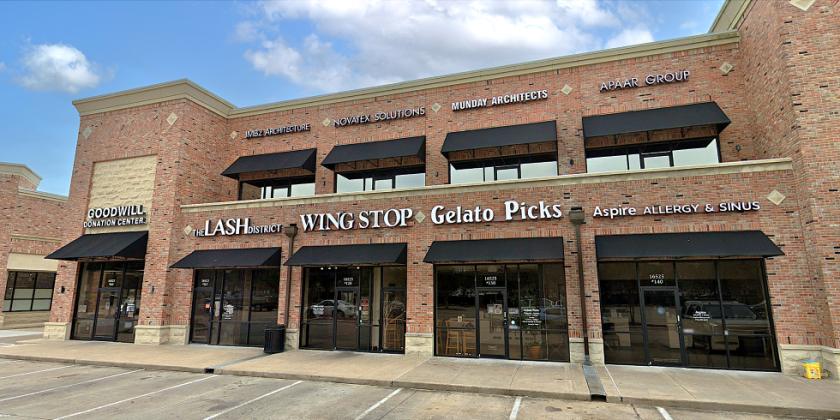
• Located at the prime intersection of Lexington Blvd and Austin Pkwy, in the heart of Sugar Land
• • Full-service leases with utilities and janitorial (twice/week)
Additional Photos


Listing Agents

Kolbe Curtice
O: 281-269-3441
M: 281-802-2260
kolbe.curtice@colliers.com
O: 281-269-3441
M: 281-802-2260
kolbe.curtice@colliers.com
While we strive to provide the most accurate information, all listing information, and demographic data, is provided by third-parties. As such, MyEListing will not be responsible for the accuracy of the information. It is strongly recommended that you verify all information with the listing agent, and any relevant agencies, prior to making any decisions.


