Industrial Properties
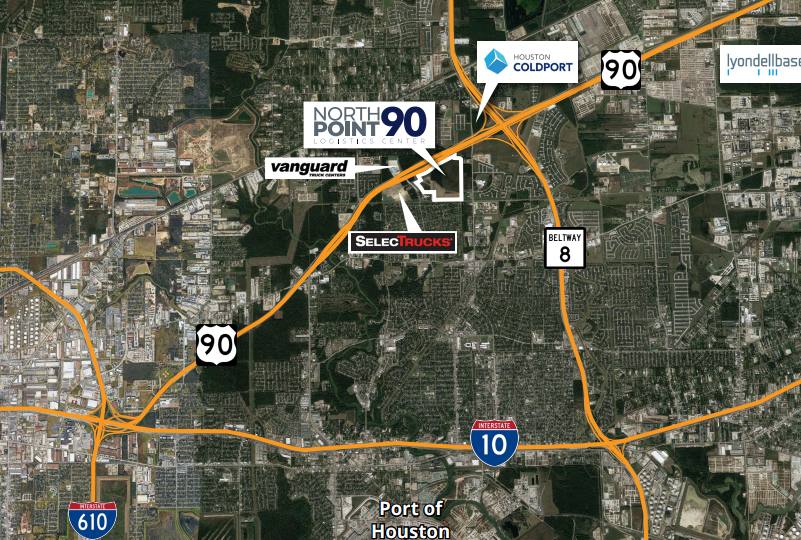
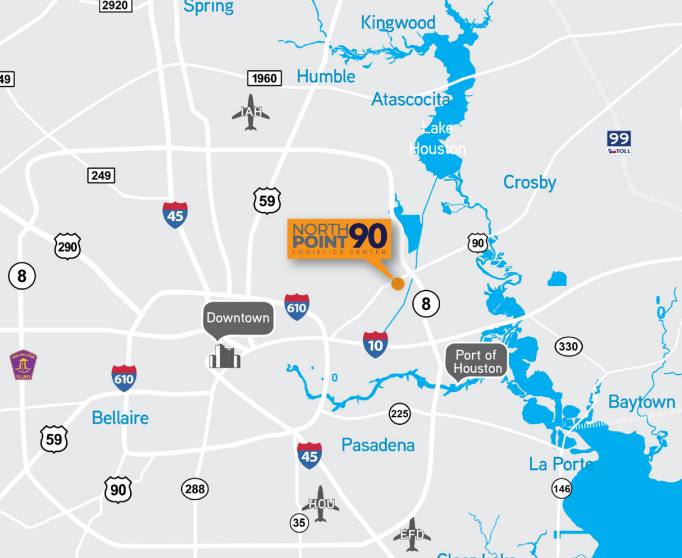
13220 Crosby Freeway Houston, TX 77049
13220 Crosby Freeway Houston, TX 77049
Details & Description
Property Highlights
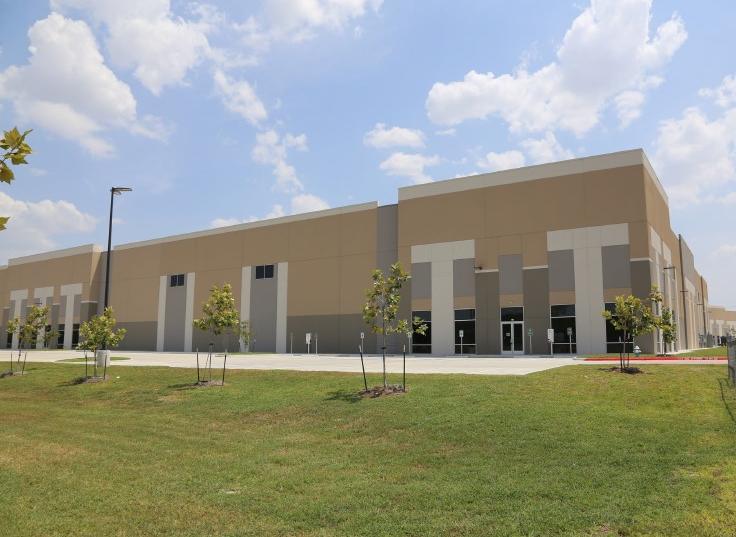
- • ±147,496 SF Building demised in half
- • Office SF: ± 2,633
- • Approximately 14 acres
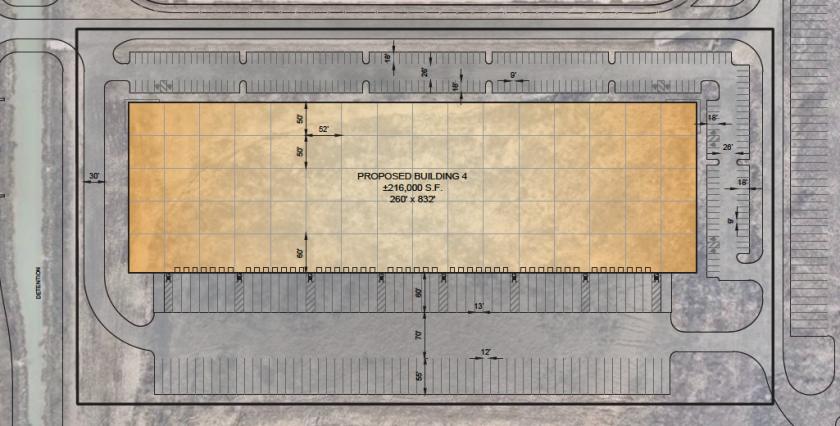
- • Configuration: Rear load
- • Column Spacing: 52' x 54'
- • 36’ Clear height
Additional Photos

Listing Agents

Blake Gibson
O: 713-830-2173
blake.gibson@colliers.com
O: 713-830-2173
blake.gibson@colliers.com

Ryan Byrd
O: 713-830-2171
M: 832-368-4884
ryan.byrd@colliers.com
O: 713-830-2171
M: 832-368-4884
ryan.byrd@colliers.com
While we strive to provide the most accurate information, all listing information, and demographic data, is provided by third-parties. As such, MyEListing will not be responsible for the accuracy of the information. It is strongly recommended that you verify all information with the listing agent, and any relevant agencies, prior to making any decisions.


