Commercial Land
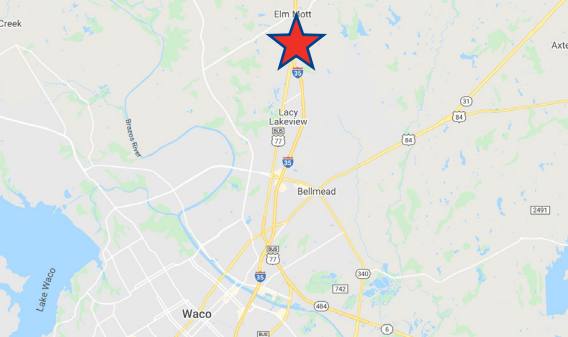
Interstate 35 Waco Lacy Lakeview, TX 76705
Interstate 35 Waco Lacy Lakeview, TX 76705
Details & Description
Property Highlights
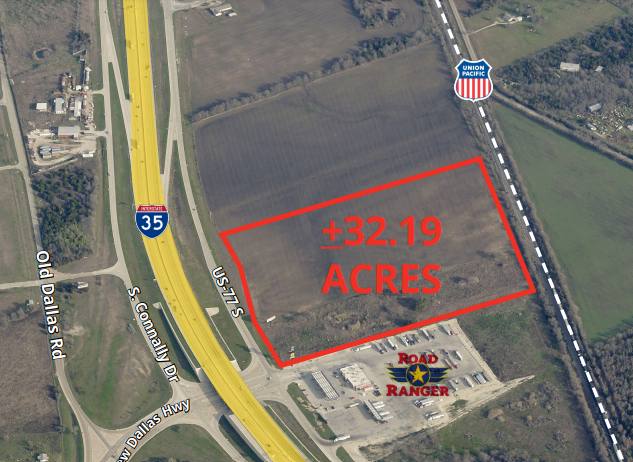
- • 1,162’ of frontage on I-35
- • 63,000 vehicles per day on I-35
- • Access to Highway Business 77/I-35 intersection
- • In the City of Lacy Lakeview
- • Additional land may be available on north side
Listing Agents

Bill Byrd
O: 713-830-2131
M: 713-628-2022
bill.byrd@colliers.com
O: 713-830-2131
M: 713-628-2022
bill.byrd@colliers.com
While we strive to provide the most accurate information, all listing information, and demographic data, is provided by third-parties. As such, MyEListing will not be responsible for the accuracy of the information. It is strongly recommended that you verify all information with the listing agent, and any relevant agencies, prior to making any decisions.