Retail Space
295 Sawdust Road Spring, TX 77380
295 Sawdust Road Spring, TX 77380
Details & Description
Property Highlights
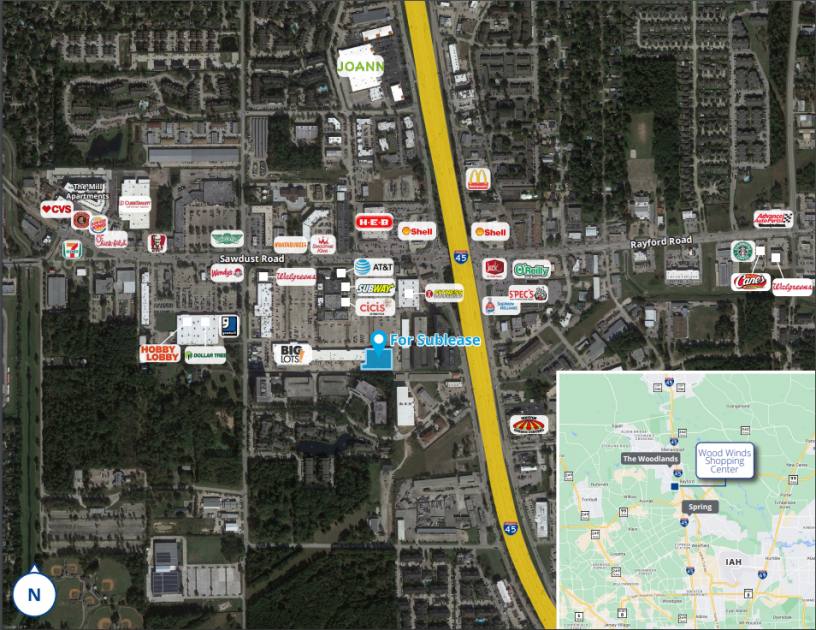
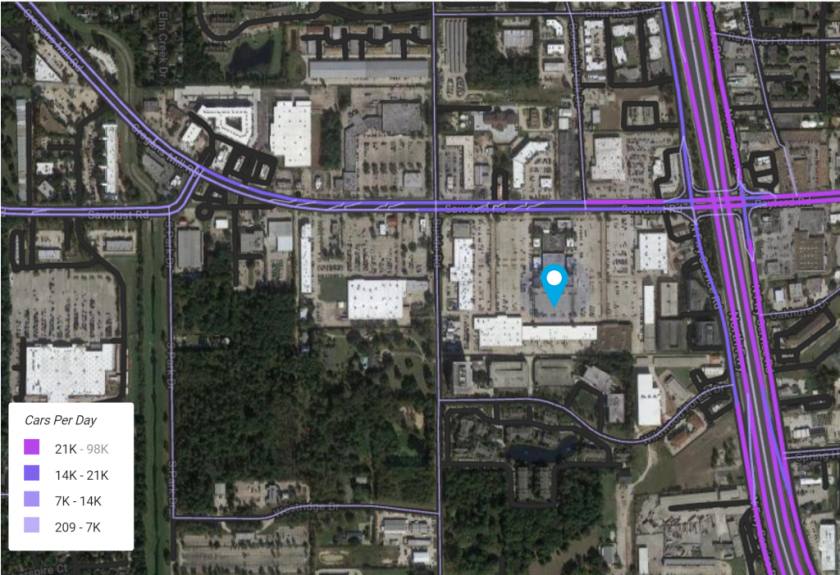
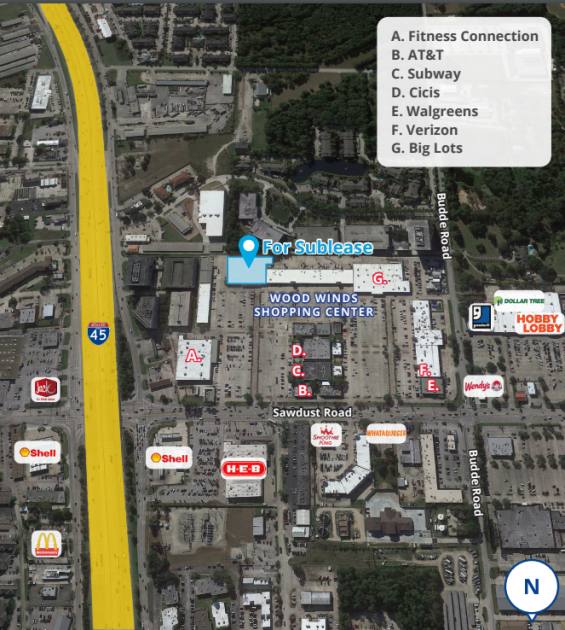
• Located in Wood Winds Shopping Center situated at the southwest corner of I-45 & Sawdust Road
• Across from H-E-B on Sawdust Road with over one million visits in the last twelve months
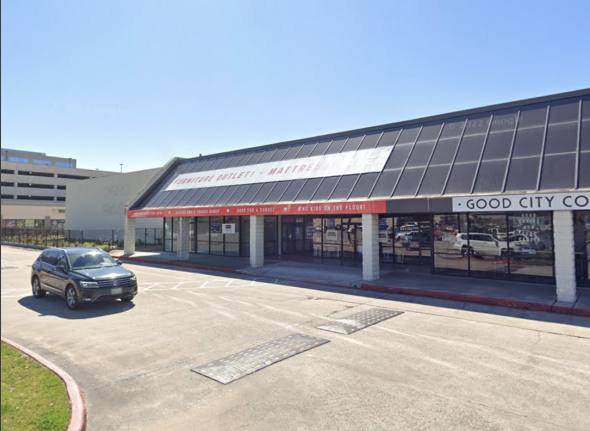
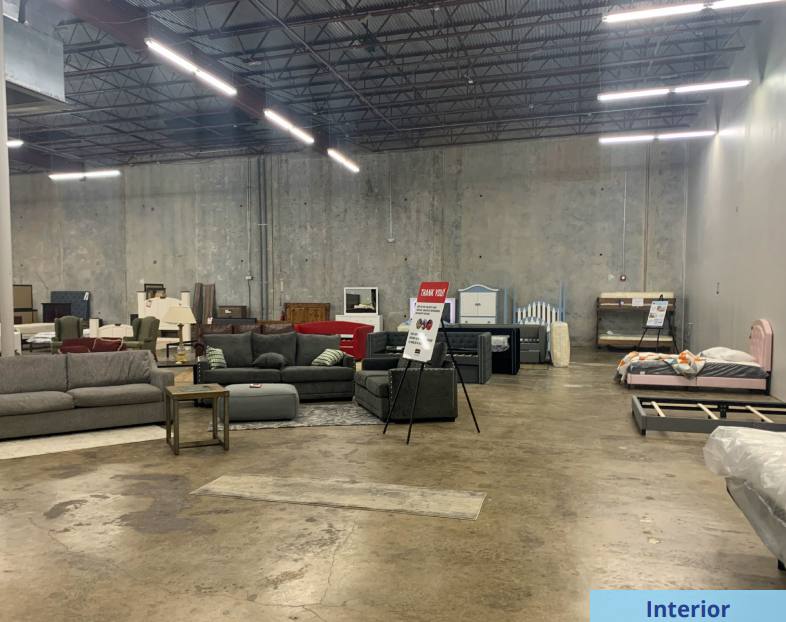
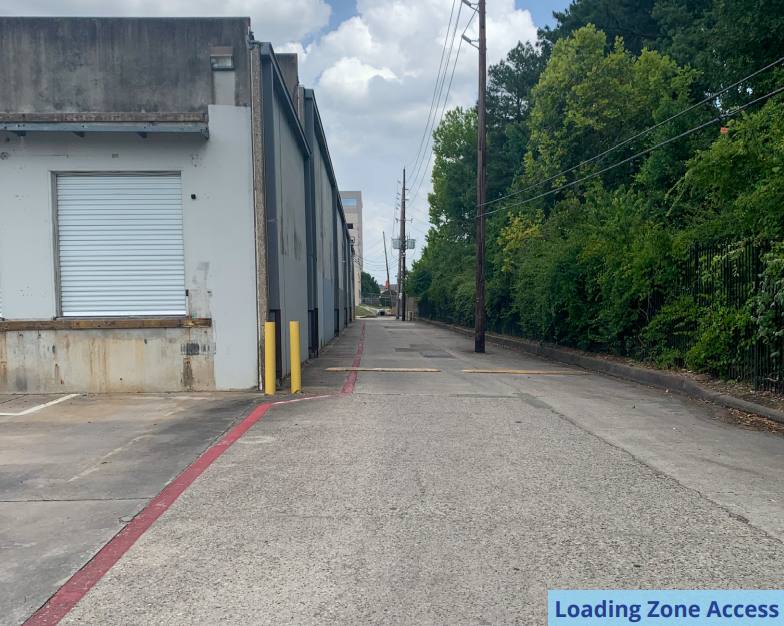
Additional Photos
Listing Agents

Kimberly Lenardson
O: 713-830-2186
M: 832-971-4885
kimberly.lenardson@colliers.com
O: 713-830-2186
M: 832-971-4885
kimberly.lenardson@colliers.com
While we strive to provide the most accurate information, all listing information, and demographic data, is provided by third-parties. As such, MyEListing will not be responsible for the accuracy of the information. It is strongly recommended that you verify all information with the listing agent, and any relevant agencies, prior to making any decisions.