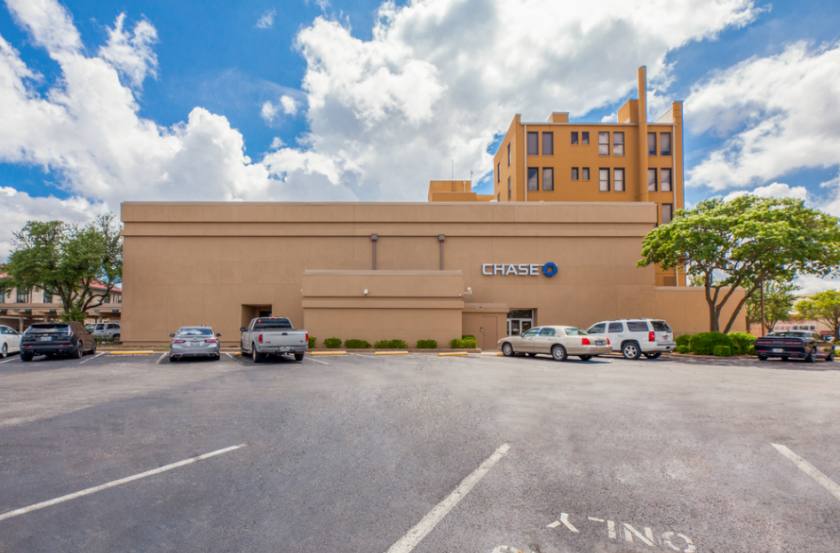
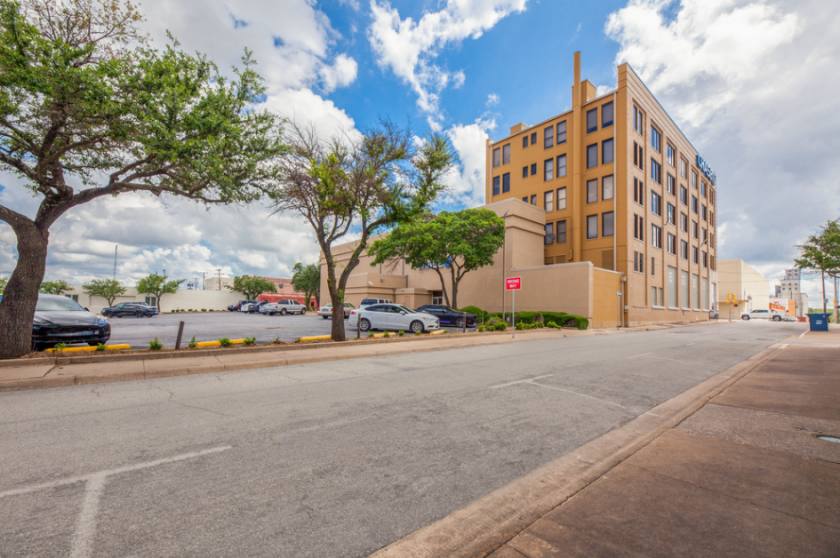
SRS Investment Properties Group has been exclusively retained to offer qualified investors the opportunity to purchase 200 North Travis (the “Property”), a 58,630± square foot office building strategically positioned in downtown Sherman, with convenient access to US-75.
The Property is located in the heart of downtown Sherman, just 1.5 miles from Austin College and 1.9 miles from Old Sherman High School. Initially built in 1889, 200 North Travis has been a landmark building in downtown Sherman for over a century and has seen continued improvement and updating over that time.
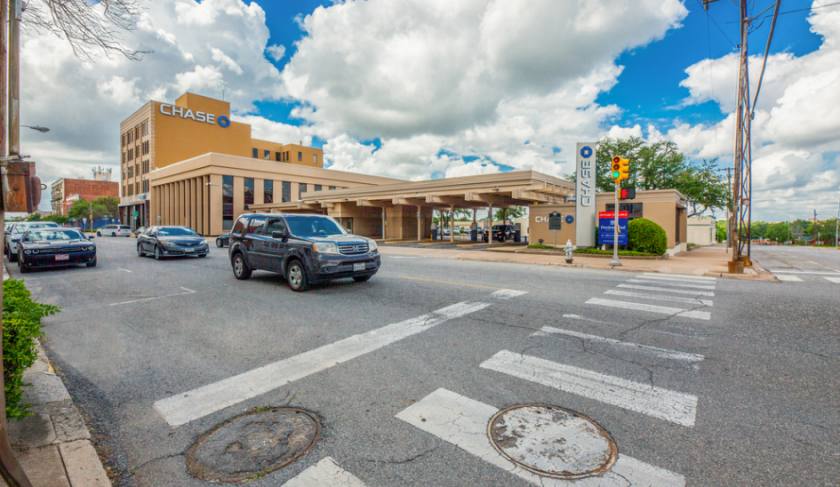
Currently 79% leased, 200 North Travis Presents investors with exceptional value-add opportunity through lease-up opportunity and strong credit in-place tenancy, including JP Morgan Chase Bank, and Federal Marshall’s Office and Courts, to provide stable cash flow.
VALUE-ADD OPPORTUNITY: In-place average rents of $15.10 PSF reflect a 10% discount to current market rents of $16.57 PSF. Leasing of the ~12,000 SF of vacancy results in an NOI increase of approximately $200,000 over the first several years
STRONG CREDIT ANCHOR TENANCY: Strong credit anchor tenants including Chase Bank, and Federal Marshall’s Office and Courts. The building also serves as offices for several local businesses as it is conveniently located and provides a variety of suite sizes and configurations
SIGNIFICANT CAPITAL IMPROVEMENTS: The building has been in continuous use and well maintained over the last 60 years. Recent capital improvements include: new roof, full wet seal of the building, 90% of windows replaced, modernized elevators, updated fire alarm panel, and ADA restroom upgrades
No part of this information may be copied, reproduced, repurposed, or screen-captured for any commercial purpose without prior written authorization from MyEListing.
While we strive to provide the most accurate information, all listing information, and demographic data, is provided by third-parties. As such, MyEListing will not be responsible for the accuracy of the information. It is strongly recommended that you verify all information with the listing agent, and any relevant agencies, prior to making any decisions.
What is the building size of this Office property in Sherman, TX?
The size of the building/unit at 200 North Travis Street in Sherman is 58,630 square feet
How much land does the Sherman, TX property at 200 North Travis Street include?
200 North Travis Street in Sherman includes 2.110 acres of land
What kind of Office is the propery at 200 North Travis Street?
The property at 200 North Travis Street Sherman, TX 75090 is listed as a Professional Office property
What is the population within 1 mile of 200 North Travis Street in Sherman?
The population within 1 mile of 200 North Travis Street Sherman, TX 75090 is 8,995 people.
Who do I contact for questions about 200 North Travis Street?
You should contact the listing agent,
Aaron Johnson, for any details regarding this commercial listing.