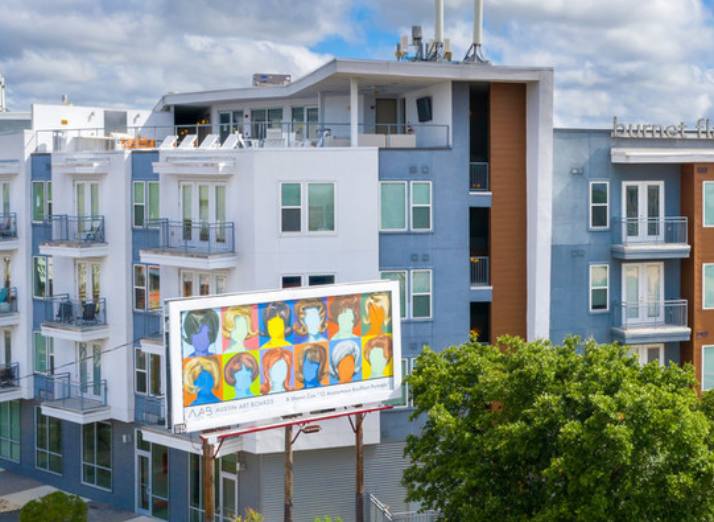
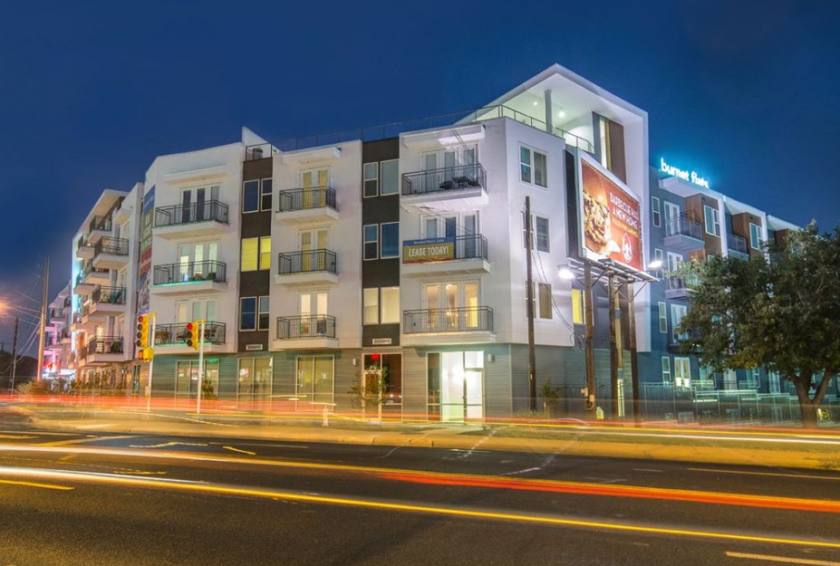
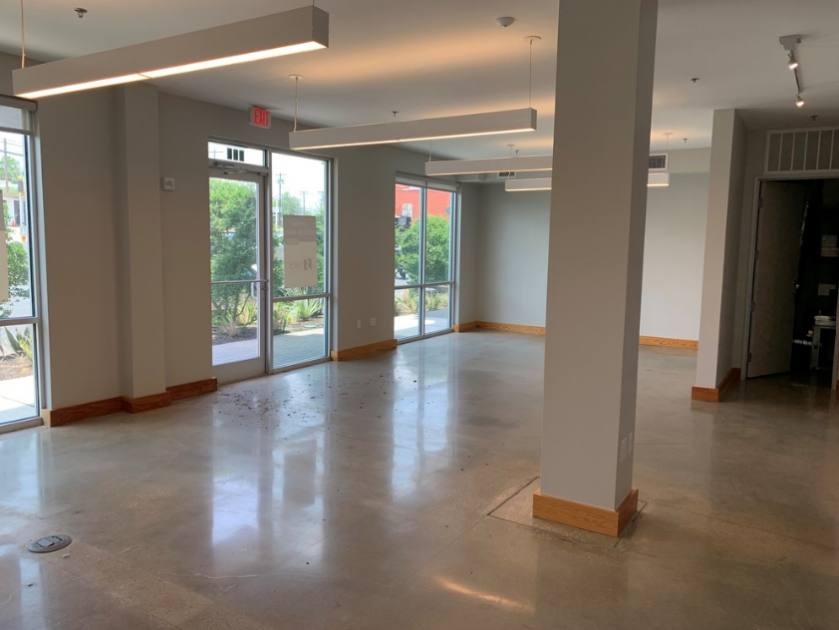
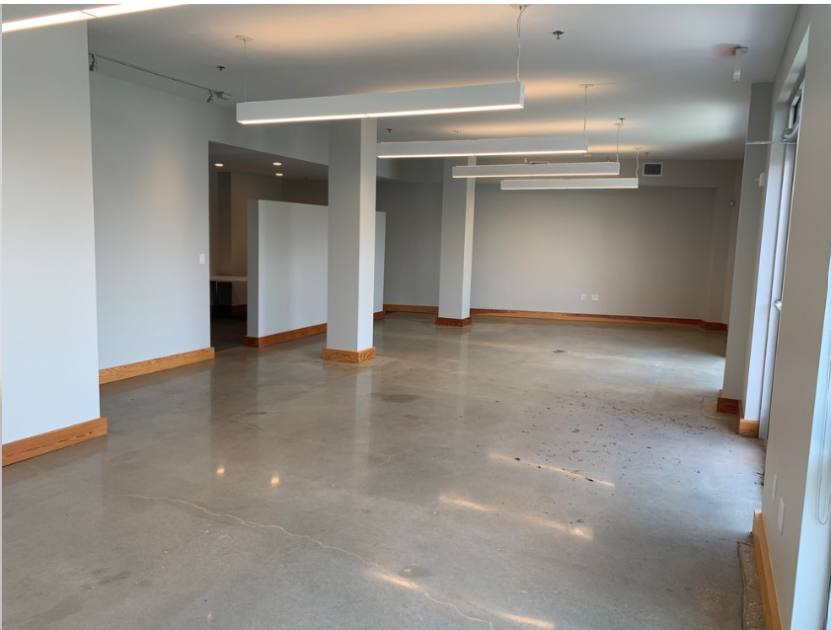
Retail Space
5453 Burnet Road Austin, TX 78756
5453 Burnet Road Austin, TX 78756
Details & Description
Property Highlights
- • High-end, mixed-use urban development
- • Ground floor retail below 179 apt. units
- • 255 structured parking spaces
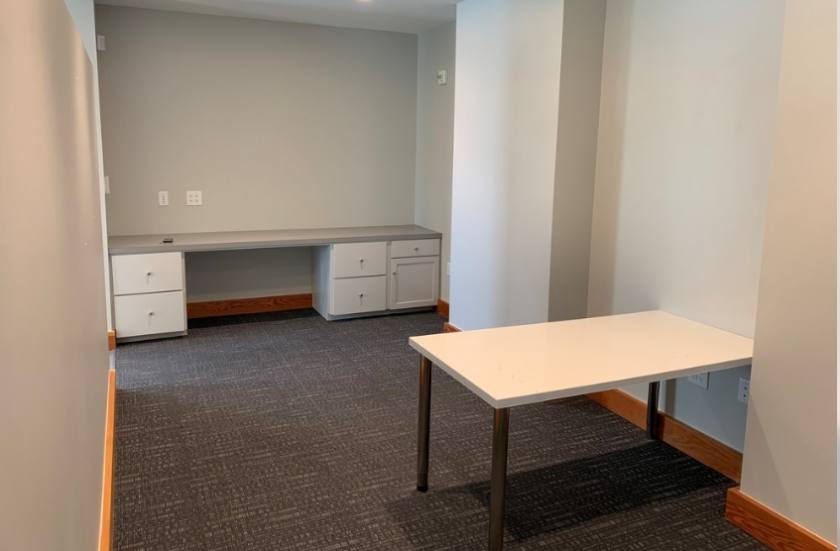
Additional Photos
Listing Agents

Adelaide Ehrlich
O: 512-236-4649
M: 512-236-4649
adelaide.ehrlich@srsre.com
O: 512-236-4649
M: 512-236-4649
adelaide.ehrlich@srsre.com

Will Majors
O: 512-236-4646
will.majors@srsre.com
O: 512-236-4646
will.majors@srsre.com
While we strive to provide the most accurate information, all listing information, and demographic data, is provided by third-parties. As such, MyEListing will not be responsible for the accuracy of the information. It is strongly recommended that you verify all information with the listing agent, and any relevant agencies, prior to making any decisions.


