Specialty Real Estate
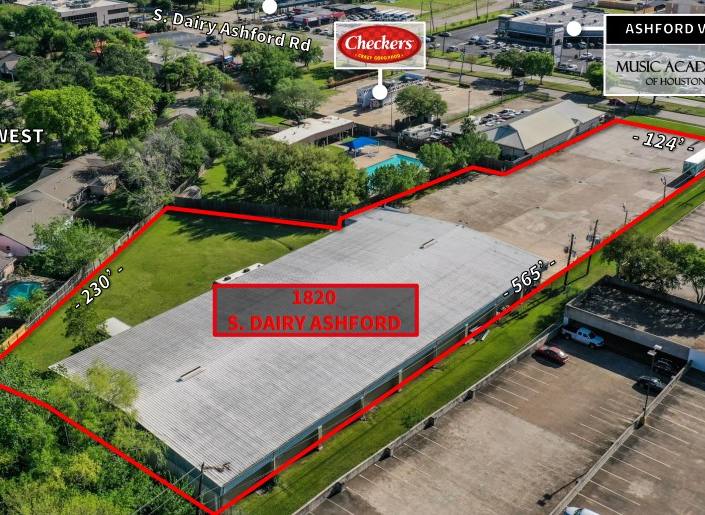
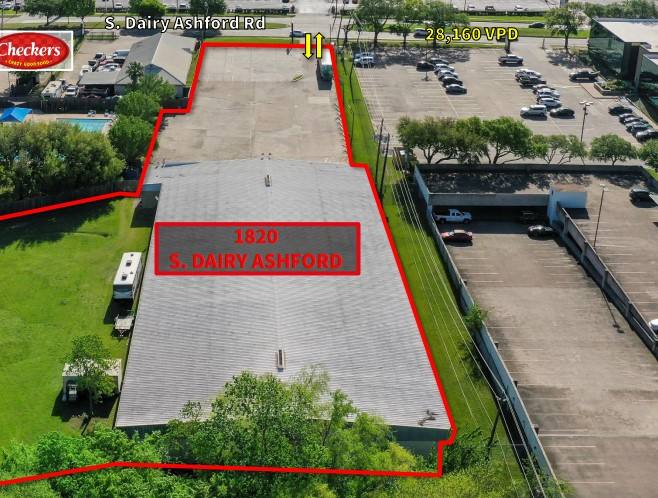
1820 South Dairy Ashford Road Houston, TX 77077
1820 South Dairy Ashford Road Houston, TX 77077
Details & Description
Property Highlights
- • HVAC - 100%
- • Utilities - City of Houston
- • Year Built 1975
- • Renovated 2018
- • Construction - Concrete block
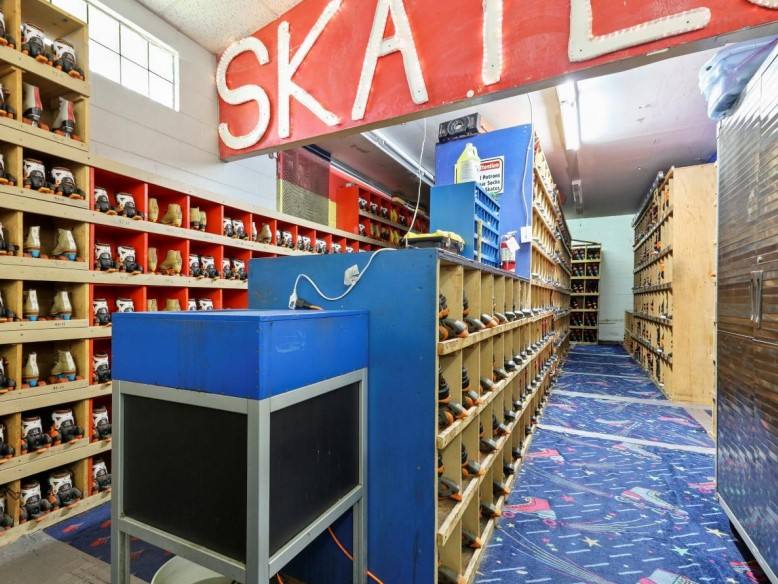
Additional Photos


Listing Agents

Barrett Von Blon
O: 713-577-1777
M: 832-563-9996
barrett.vonblon@cbre.com
O: 713-577-1777
M: 832-563-9996
barrett.vonblon@cbre.com

Mark Nicholas
JLL
O: 713-888-4024
mark.nicholas@am.jll.com
JLL
O: 713-888-4024
mark.nicholas@am.jll.com
While we strive to provide the most accurate information, all listing information, and demographic data, is provided by third-parties. As such, MyEListing will not be responsible for the accuracy of the information. It is strongly recommended that you verify all information with the listing agent, and any relevant agencies, prior to making any decisions.


