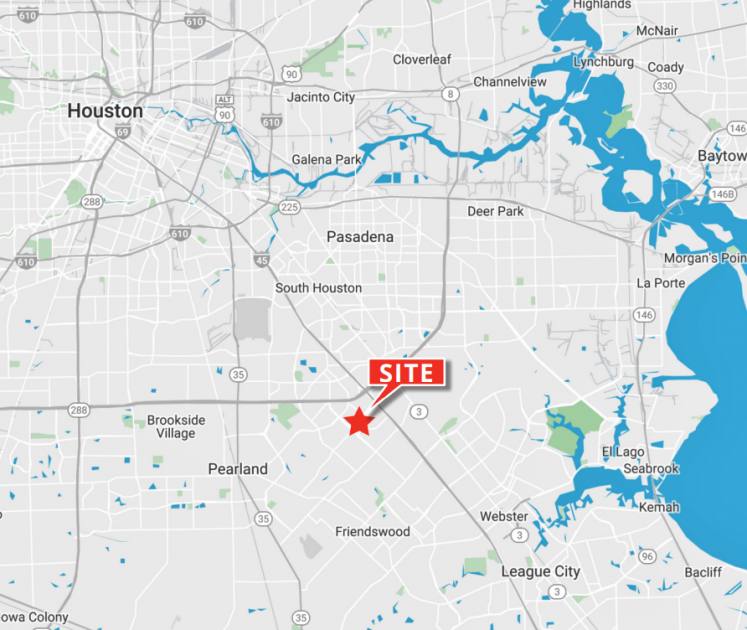
Commercial Land
Beamer Road Houston, TX 77048
Beamer Road Houston, TX 77048
Details & Description
Property Highlights
- • Located in Houston ETJ
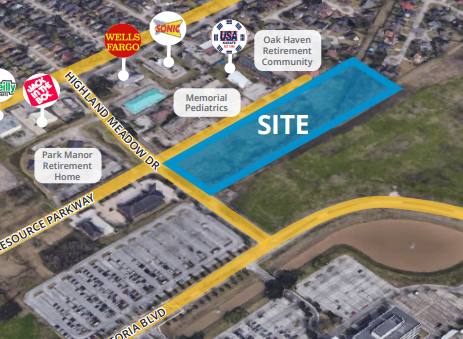
- • 4.72 ac (205,603 sf)
- • Seller financing available
- • All utilities - no restrictions
- • Tax Rate: $2.7465 / $100
Listing Agents

Kelly Hutchinson
O: 713-830-2146
M: 281-830-9747
kelly.hutchinson@colliers.com
O: 713-830-2146
M: 281-830-9747
kelly.hutchinson@colliers.com
While we strive to provide the most accurate information, all listing information, and demographic data, is provided by third-parties. As such, MyEListing will not be responsible for the accuracy of the information. It is strongly recommended that you verify all information with the listing agent, and any relevant agencies, prior to making any decisions.