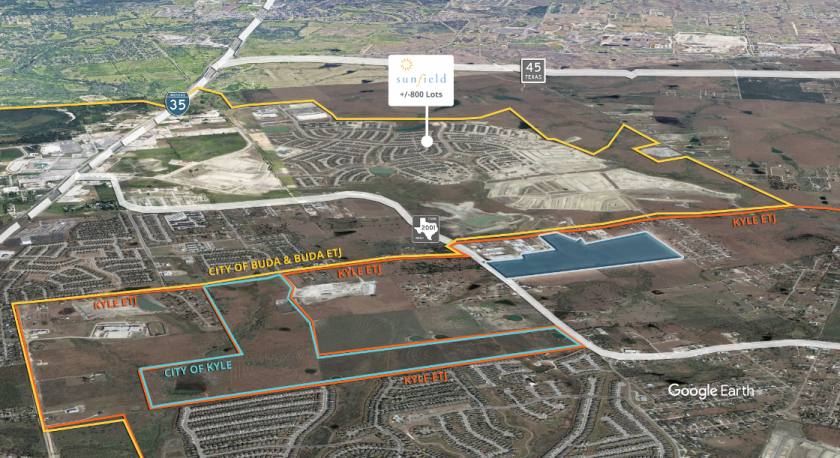
1-Mile | 3-Miles | 5-Miles | ||
---|---|---|---|---|
Total Population | 3,583 | 28,163 | 59,373 | |
Population Median Age | 32 | 32 | 33 | |
Population by Age | 0-9 Yrs | 590 (16%) | 4659 (16%) | 10550 (17%) |
10-19 Yrs | 440 (12%) | 3524 (12%) | 7631 (12%) | |
20-29 Yrs | 630 (17%) | 4512 (16%) | 8212 (13%) | |
30-39 Yrs | 876 (24%) | 6015 (21%) | 10683 (17%) | |
40-49 Yrs | 331 (9%) | 3398 (12%) | 8618 (14%) | |
50-59 Yrs | 433 (12%) | 3064 (10%) | 6228 (10%) | |
60-69 Yrs | 161 (4%) | 2001 (7%) | 4714 (7%) | |
70+ Yrs | 123 (3%) | 990 (3%) | 2737 (4%) | |
Median HH Income | $83,380 | $80,699 | $78,012 | |
Total Household Income | < 24K | 97 (8%) | 862 (9%) | 1868 (9%) |
25-49K | 160 (13%) | 1503 (16%) | 3482 (18%) | |
50-74K | 209 (18%) | 1681 (18%) | 3836 (20%) | |
75-99K | 332 (28%) | 1897 (21%) | 3344 (17%) | |
100-199K | 302 (26%) | 2413 (26%) | 5386 (28%) | |
200K+ | 53 (4%) | 601 (6%) | 1261 (6%) | |
Highest Education Level | No Diploma | 227 | 2103 | 4583 |
Diploma or GED | 680 | 5368 | 9556 | |
Some College | 444 | 3542 | 7806 | |
Assoc. Degree | 235 | 1142 | 2185 | |
Bachelors Degree | 460 | 3567 | 8641 | |
Higher Degree | 260 | 1956 | 4004 | |
Total Housing Units | 1,206 | 9,226 | 20,106 | |
--Owner-Occupied | 924 | 6,031 | 13,549 | |
--Renter-Occupied | 230 | 2,926 | 5,629 | |
Owner-Occupied Values | < 100K | 55 | 358 | 1271 |
100-199K | 175 | 1186 | 2611 | |
200-299K | 556 | 3261 | 6260 | |
300-399K | 103 | 790 | 2309 | |
400-499K | 2 | 28 | 550 | |
500K+ | 33 | 408 | 548 | |
Total Working Age Population | 2,656 | 21,117 | 43,854 | |
In Work Force | 2,039 | 15,612 | 31,736 | |
Not In Work Force | 618 | 5,505 | 12,117 | |
Workforce Employed | 1,960 | 14,927 | 30,477 | |
Workforce Unemployed | 47 | 607 | 1,163 | |
Civlian Workforce | 2,007 | 15,534 | 31,641 | |
Military Workforce | 31 | 78 | 96 | |
Total Households | 1,154 | 8,956 | 19,178 | |
Family Households | 886 | 6,727 | 14,343 | |
Non-Family Households | 267 | 2,229 | 4,835 | |
Married Couple | 590 | 5,119 | 11,264 | |
Other Family | 296 | 1,608 | 3,079 | |
Married w/Child | 285 | 2,529 | 5,871 | |
Single Male w/Child | 89 | 349 | 599 | |
Single Female w/Child | 85 | 490 | 1,160 |
Population Change Last Two Decades - Plus Projection
2000 | % | 2010 | % | 2020 | % | 2030 | |
---|---|---|---|---|---|---|---|
Texas | 20,851,820 | +21 | 25,145,561 | +18 | 29,677,668 | +18 | 34,894,452 |
Travis County | 812,280 | +26 | 1,024,266 | +26 | 1,291,502 | +19 | 1,540,812 |
Hays County | 97,589 | +61 | 157,107 | +50 | 234,896 | +48 | 347,120 |
Total Working Age Population:
Total Households:
Total Working Age Population:
Total Households:
Total Working Age Population:
Total Households: