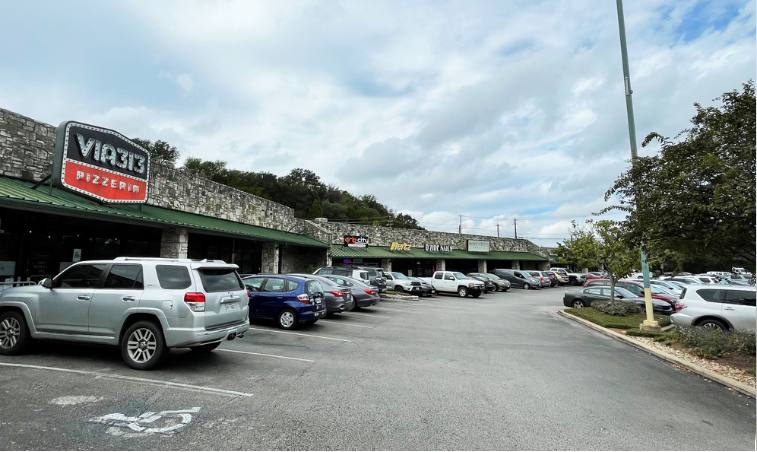
1-Mile | 3-Miles | 5-Miles | ||
---|---|---|---|---|
Total Population | 7,880 | 64,420 | 158,918 | |
Population Median Age | 42 | 39 | 38 | |
Population by Age | 0-9 Yrs | 841 (10%) | 7746 (12%) | 19575 (12%) |
10-19 Yrs | 763 (9%) | 6812 (10%) | 16621 (10%) | |
20-29 Yrs | 780 (9%) | 7631 (11%) | 19019 (11%) | |
30-39 Yrs | 1208 (15%) | 11002 (17%) | 27737 (17%) | |
40-49 Yrs | 958 (12%) | 9736 (15%) | 24917 (15%) | |
50-59 Yrs | 1437 (18%) | 9083 (14%) | 20768 (13%) | |
60-69 Yrs | 1204 (15%) | 8186 (12%) | 18534 (11%) | |
70+ Yrs | 689 (8%) | 4225 (6%) | 11747 (7%) | |
Median HH Income | $100,008 | $98,320 | $97,753 | |
Total Household Income | < 24K | 270 (8%) | 2084 (7%) | 6084 (9%) |
25-49K | 304 (9%) | 3064 (11%) | 8741 (13%) | |
50-74K | 534 (16%) | 4486 (16%) | 10009 (15%) | |
75-99K | 537 (16%) | 4031 (15%) | 8575 (13%) | |
100-199K | 1140 (34%) | 9562 (35%) | 21251 (32%) | |
200K+ | 505 (15%) | 3562 (13%) | 10618 (16%) | |
Highest Education Level | No Diploma | 257 | 1689 | 5203 |
Diploma or GED | 538 | 5087 | 12805 | |
Some College | 790 | 7920 | 19917 | |
Assoc. Degree | 348 | 2733 | 6186 | |
Bachelors Degree | 2428 | 17618 | 43969 | |
Higher Degree | 1564 | 12112 | 28169 | |
Total Housing Units | 3,571 | 28,403 | 69,422 | |
--Owner-Occupied | 2,323 | 16,281 | 40,531 | |
--Renter-Occupied | 967 | 10,509 | 24,747 | |
Owner-Occupied Values | < 100K | 28 | 298 | 659 |
100-199K | 86 | 633 | 1622 | |
200-299K | 356 | 2673 | 7127 | |
300-399K | 1006 | 6005 | 12225 | |
400-499K | 583 | 3991 | 8313 | |
500K+ | 265 | 2680 | 10584 | |
Total Working Age Population | 6,615 | 51,931 | 128,006 | |
In Work Force | 4,687 | 38,342 | 92,924 | |
Not In Work Force | 1,928 | 13,589 | 35,081 | |
Workforce Employed | 4,506 | 36,446 | 89,331 | |
Workforce Unemployed | 181 | 1,896 | 3,573 | |
Civlian Workforce | 4,687 | 38,342 | 92,904 | |
Military Workforce | 0 | 0 | 20 | |
Total Households | 3,290 | 26,789 | 65,278 | |
Family Households | 2,068 | 16,468 | 39,466 | |
Non-Family Households | 1,222 | 10,321 | 25,812 | |
Married Couple | 1,805 | 13,463 | 32,275 | |
Other Family | 263 | 3,006 | 7,191 | |
Married w/Child | 628 | 5,671 | 14,667 | |
Single Male w/Child | 36 | 395 | 1,006 | |
Single Female w/Child | 109 | 1,024 | 2,491 |
Population Change Last Two Decades - Plus Projection
2000 | % | 2010 | % | 2020 | % | 2030 | |
---|---|---|---|---|---|---|---|
Texas | 20,851,820 | +21 | 25,145,561 | +18 | 29,677,668 | +18 | 34,894,452 |
Travis County | 812,280 | +26 | 1,024,266 | +26 | 1,291,502 | +19 | 1,540,812 |
Total Working Age Population:
Total Households:
Total Working Age Population:
Total Households:
Total Working Age Population:
Total Households: