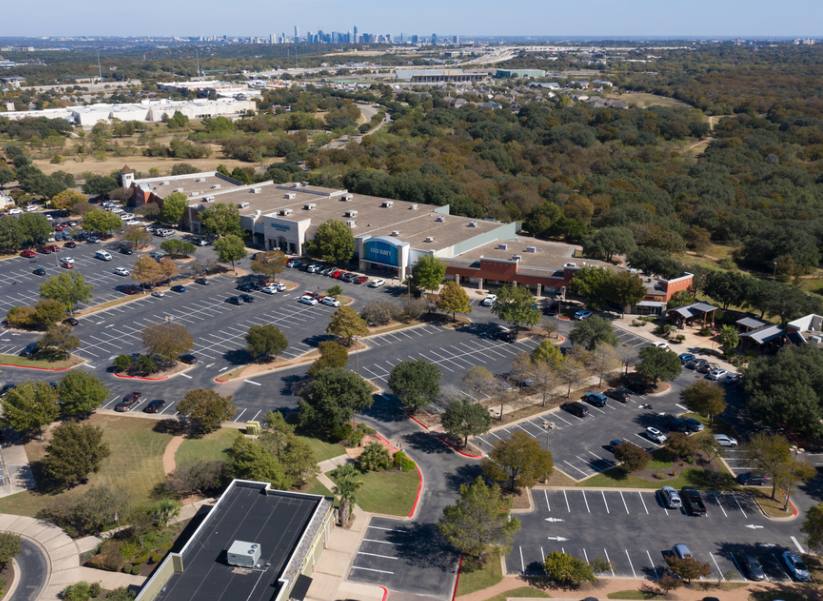
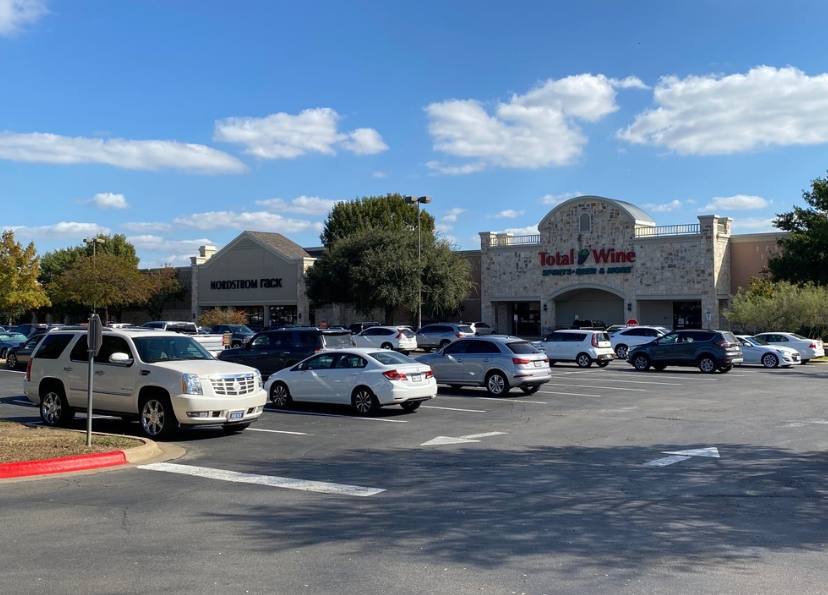
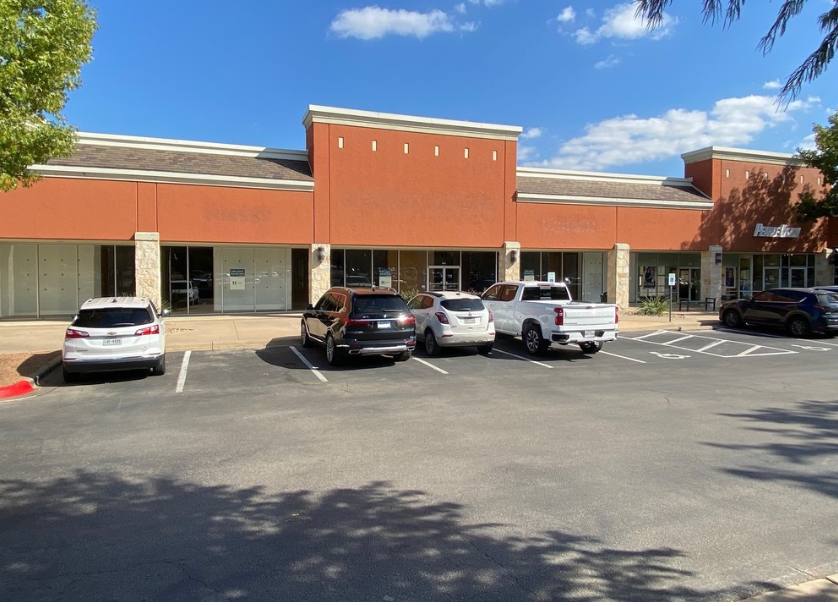
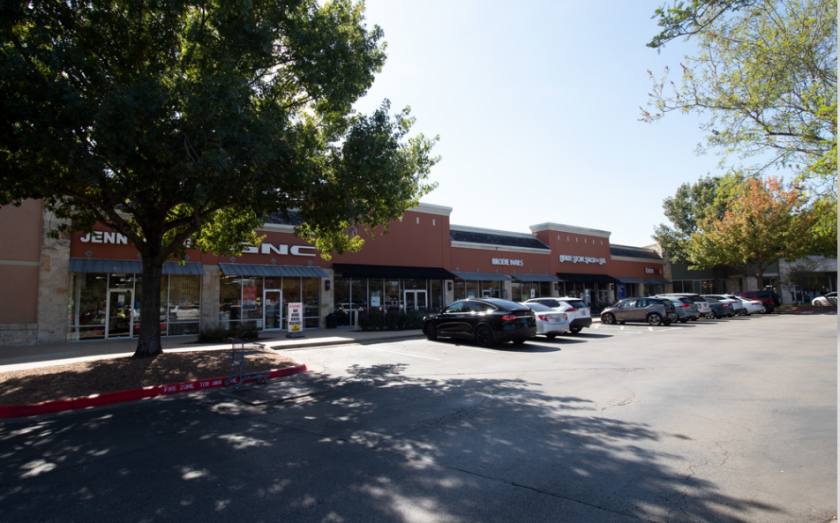
1-Mile | 3-Miles | 5-Miles | ||
---|---|---|---|---|
Total Population | 8,800 | 100,515 | 265,076 | |
Population Median Age | 36 | 39 | 37 | |
Population by Age | 0-9 Yrs | 1015 (11%) | 10165 (10%) | 29430 (11%) |
10-19 Yrs | 411 (4%) | 7907 (7%) | 24714 (9%) | |
20-29 Yrs | 2081 (23%) | 16754 (16%) | 46186 (17%) | |
30-39 Yrs | 2387 (27%) | 20724 (20%) | 52859 (19%) | |
40-49 Yrs | 777 (8%) | 14463 (14%) | 38276 (14%) | |
50-59 Yrs | 639 (7%) | 11998 (11%) | 31122 (11%) | |
60-69 Yrs | 1082 (12%) | 11372 (11%) | 25503 (9%) | |
70+ Yrs | 408 (4%) | 7132 (7%) | 16986 (6%) | |
Median HH Income | $73,133 | $80,758 | $82,449 | |
Total Household Income | < 24K | 376 (8%) | 5122 (11%) | 13679 (11%) |
25-49K | 782 (18%) | 7727 (17%) | 19280 (16%) | |
50-74K | 1088 (25%) | 8269 (18%) | 19652 (17%) | |
75-99K | 770 (17%) | 6260 (13%) | 15748 (13%) | |
100-199K | 997 (23%) | 13420 (29%) | 32266 (28%) | |
200K+ | 312 (7%) | 4322 (9%) | 13984 (12%) | |
Highest Education Level | No Diploma | 168 | 4583 | 14882 |
Diploma or GED | 859 | 9510 | 26202 | |
Some College | 1149 | 14378 | 34692 | |
Assoc. Degree | 370 | 4663 | 10948 | |
Bachelors Degree | 2147 | 28052 | 70368 | |
Higher Degree | 1867 | 15903 | 38935 | |
Total Housing Units | 4,587 | 48,197 | 122,177 | |
--Owner-Occupied | 1,030 | 22,405 | 55,821 | |
--Renter-Occupied | 3,294 | 22,714 | 58,789 | |
Owner-Occupied Values | < 100K | 4 | 353 | 1473 |
100-199K | 79 | 1368 | 4392 | |
200-299K | 182 | 5801 | 12409 | |
300-399K | 287 | 7871 | 15527 | |
400-499K | 298 | 3723 | 8870 | |
500K+ | 179 | 3289 | 13151 | |
Total Working Age Population | 7,521 | 85,066 | 220,359 | |
In Work Force | 5,822 | 64,144 | 167,133 | |
Not In Work Force | 1,699 | 20,922 | 53,226 | |
Workforce Employed | 5,270 | 61,387 | 160,156 | |
Workforce Unemployed | 551 | 2,748 | 6,935 | |
Civlian Workforce | 5,822 | 64,135 | 167,090 | |
Military Workforce | 0 | 9 | 42 | |
Total Households | 4,324 | 45,119 | 114,610 | |
Family Households | 1,918 | 22,919 | 59,612 | |
Non-Family Households | 2,406 | 22,200 | 54,997 | |
Married Couple | 1,567 | 17,201 | 44,904 | |
Other Family | 351 | 5,718 | 14,708 | |
Married w/Child | 493 | 6,639 | 18,824 | |
Single Male w/Child | 27 | 793 | 1,786 | |
Single Female w/Child | 106 | 1,799 | 5,614 |
Population Change Last Two Decades - Plus Projection
2000 | % | 2010 | % | 2020 | % | 2030 | |
---|---|---|---|---|---|---|---|
Texas | 20,851,820 | +21 | 25,145,561 | +18 | 29,677,668 | +18 | 34,894,452 |
Travis County | 812,280 | +26 | 1,024,266 | +26 | 1,291,502 | +19 | 1,540,812 |
Total Working Age Population:
Total Households:
Total Working Age Population:
Total Households:
Total Working Age Population:
Total Households: