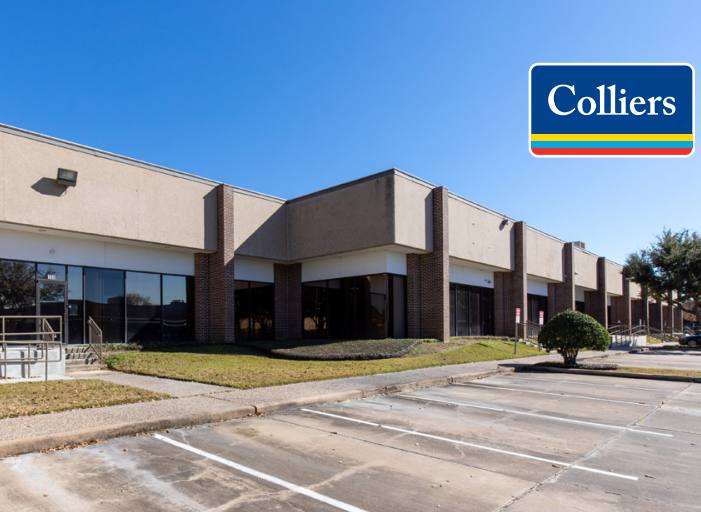
Flex-Office-Warehouse
16115 and 16155 Park Row Houston, TX 77084
16115 and 16155 Park Row Houston, TX 77084
Details & Description
Property Highlights
- • Master-planned business park in Energy Corridor
- • Easy access to I-10 and Highway 6
- • Separate parking and loading areas
- • Professionally managed landscaping
- • Strong institutional owners
- • Strong corporate identity
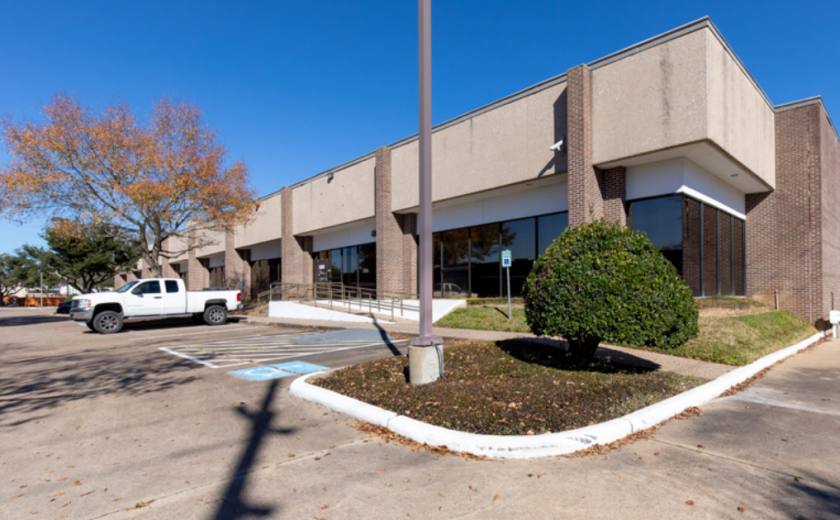
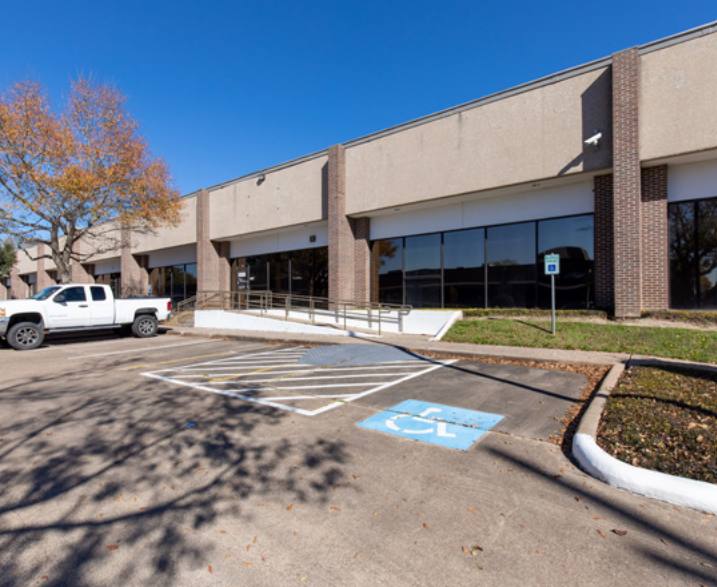
Additional Photos

Listing Agents

Douglas Pack
O: 713-835-0041
M: 713-818-5782
doug.pack@colliers.com
O: 713-835-0041
M: 713-818-5782
doug.pack@colliers.com

Sam Hansen
O: 713-835-0040
M: 281-684-1766
sam.hansen@colliers.com
O: 713-835-0040
M: 281-684-1766
sam.hansen@colliers.com

Preston Smith
Colliers
O: 713-835-0071
M: 832-459-5098
preston.smith@colliers.com
Colliers
O: 713-835-0071
M: 832-459-5098
preston.smith@colliers.com
While we strive to provide the most accurate information, all listing information, and demographic data, is provided by third-parties. As such, MyEListing will not be responsible for the accuracy of the information. It is strongly recommended that you verify all information with the listing agent, and any relevant agencies, prior to making any decisions.


