Specialty Real Estate
2500 Debra Lane Corpus Christi, TX 78418
2500 Debra Lane Corpus Christi, TX 78418
Details & Description
Property Highlights
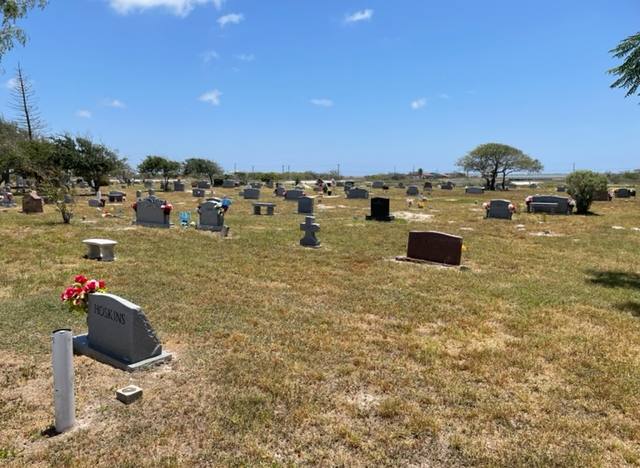
- • Thousands of platted plots in inventory for sale.
- • Good income from existing plot owners
- • Over $100,000 in gross income in 2021.
Additional Photos

Listing Agents

Jeff Smith
M: 361-443-3399
jsmith@thesmithcompany.com
M: 361-443-3399
jsmith@thesmithcompany.com
While we strive to provide the most accurate information, all listing information, and demographic data, is provided by third-parties. As such, MyEListing will not be responsible for the accuracy of the information. It is strongly recommended that you verify all information with the listing agent, and any relevant agencies, prior to making any decisions.


