Specialty Real Estate
3966 Walden Avenue Lancaster, NY 14086
3966 Walden Avenue Lancaster, NY 14086

Details & Description
Property Highlights
- • Corner Parcel
- • Great Visibility
- • Immediately Available
- • Landlord onsite
- • Zoned MFMU - Multifamily Mixed-Use Residential
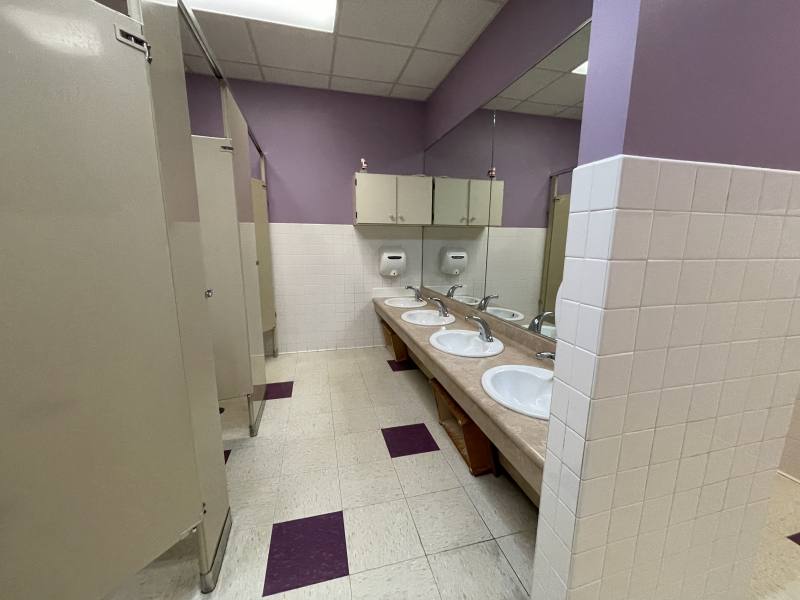
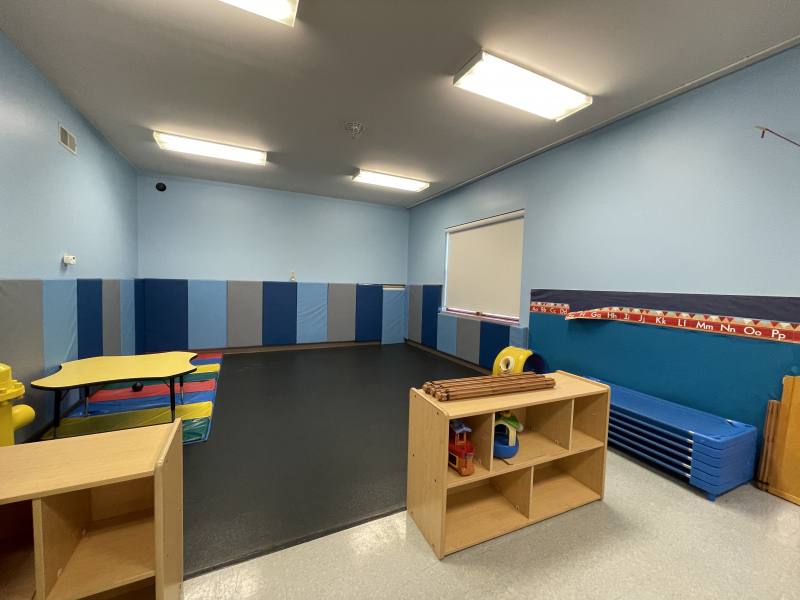
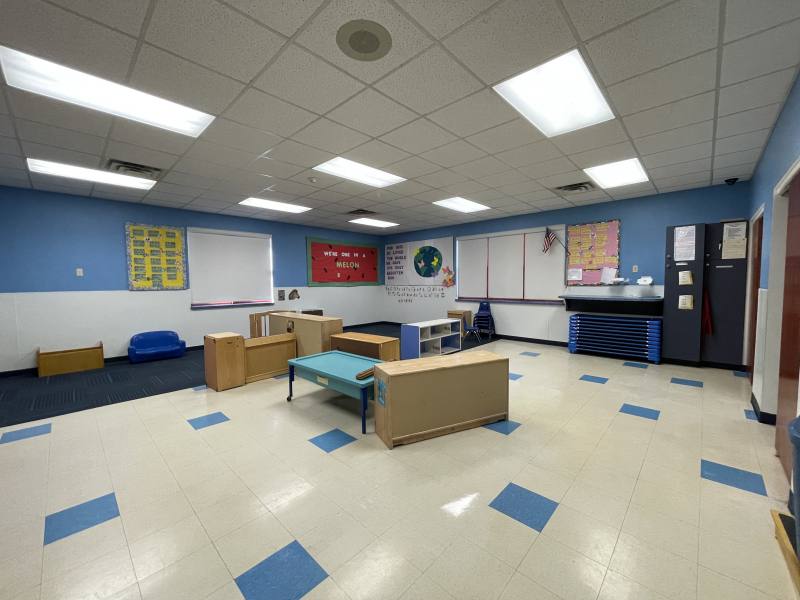
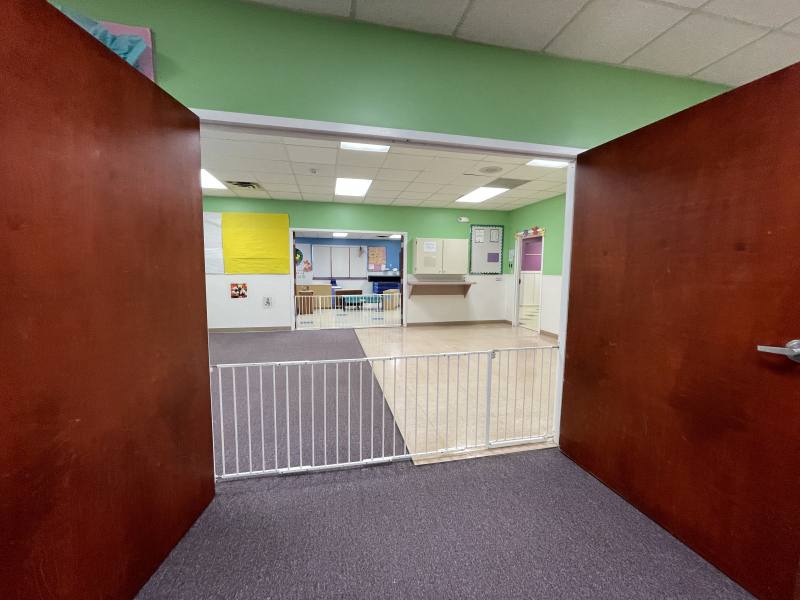
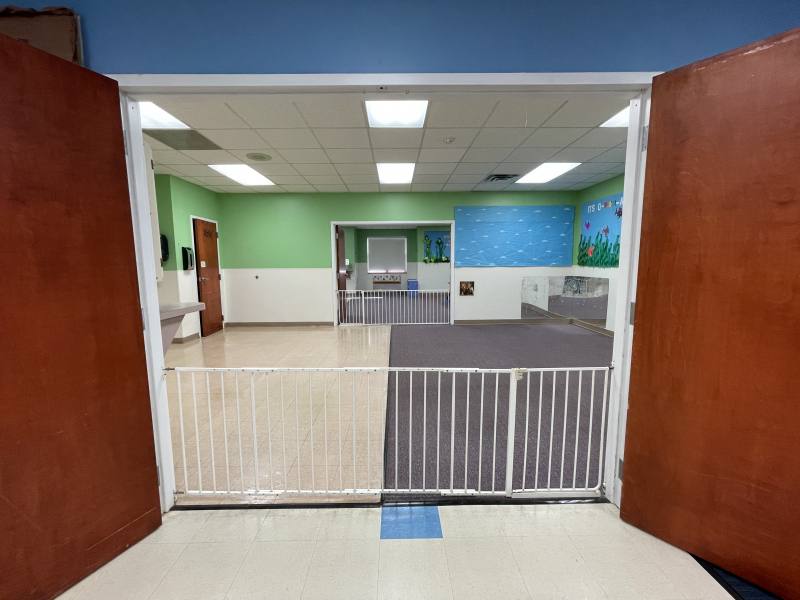
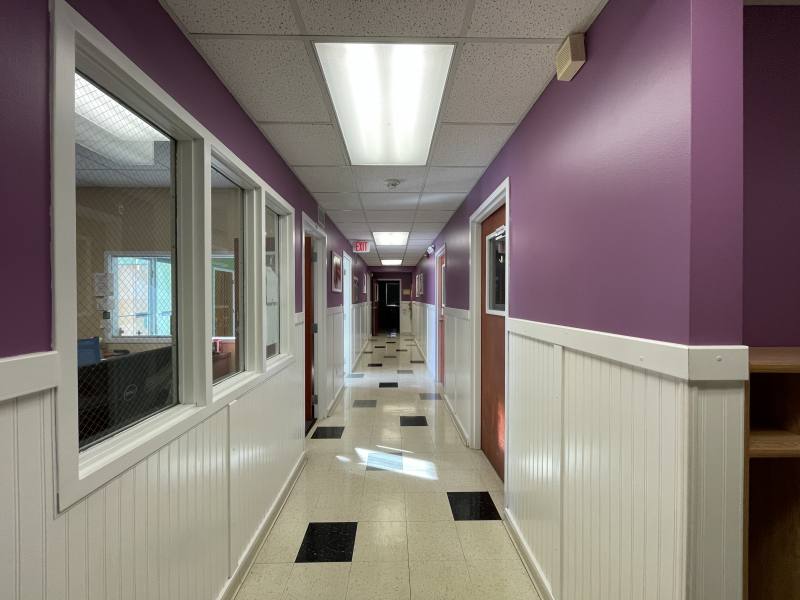
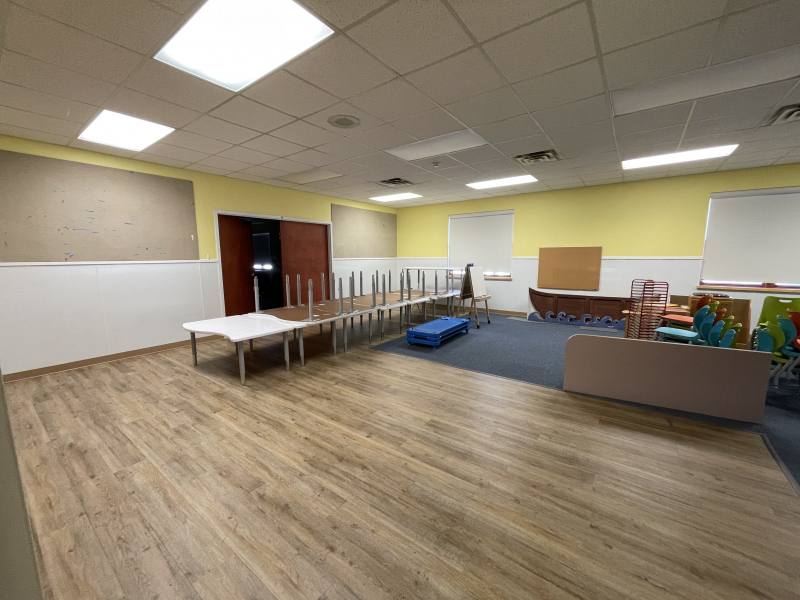
Additional Photos


Listing Agents

Alicia Wittman
O: 716-239-9001
awittman@hannacre.com
O: 716-239-9001
awittman@hannacre.com
While we strive to provide the most accurate information, all listing information, and demographic data, is provided by third-parties. As such, MyEListing will not be responsible for the accuracy of the information. It is strongly recommended that you verify all information with the listing agent, and any relevant agencies, prior to making any decisions.