Industrial Properties
243 - 261 Manhattan Ave Buffalo, NY 14215
243 - 261 Manhattan Ave Buffalo, NY 14215

Details & Description
Property Highlights
- • Northland Opportunity Zone Cluster per city map
- • 2022 new 80k btu high efficiency furnace at 243
- • 243 3 phase, 400 AMP, Ballistic Glass
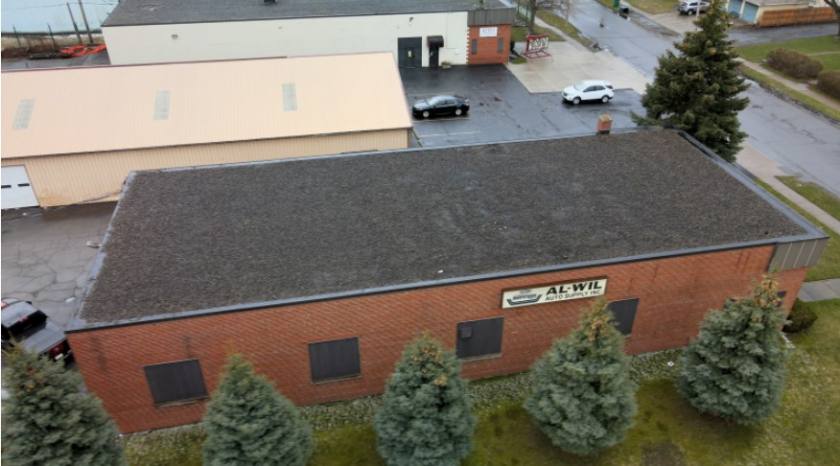
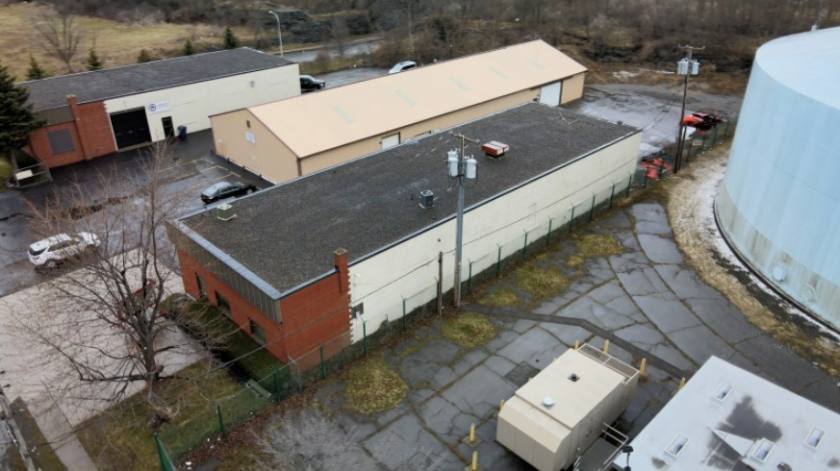
Additional Photos

Listing Agents

Alicia Wittman
O: 716-239-9001
awittman@hannacre.com
O: 716-239-9001
awittman@hannacre.com

Michael Schwartz
O: 716-856-7107
mschwartz@hannacre.com
O: 716-856-7107
mschwartz@hannacre.com
While we strive to provide the most accurate information, all listing information, and demographic data, is provided by third-parties. As such, MyEListing will not be responsible for the accuracy of the information. It is strongly recommended that you verify all information with the listing agent, and any relevant agencies, prior to making any decisions.


