Office Space
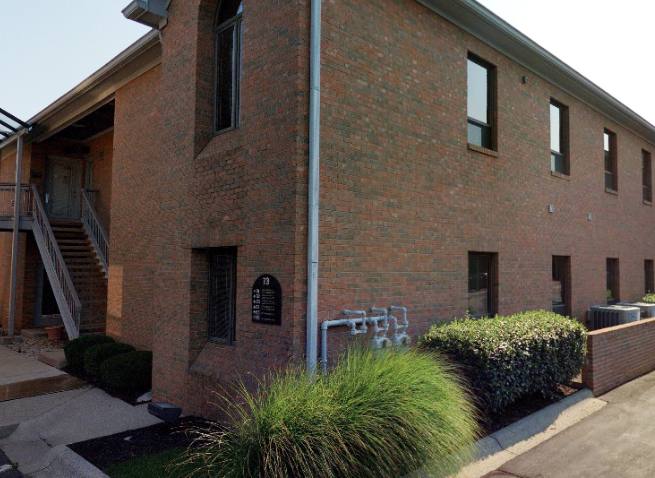
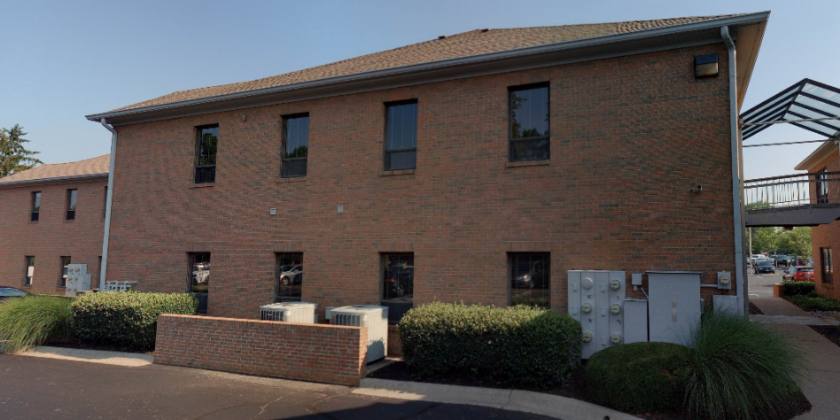
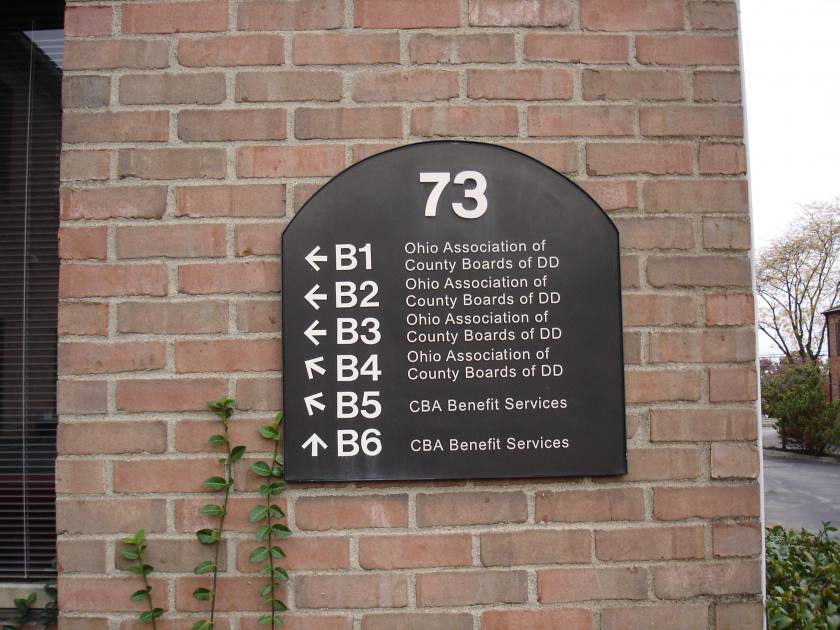
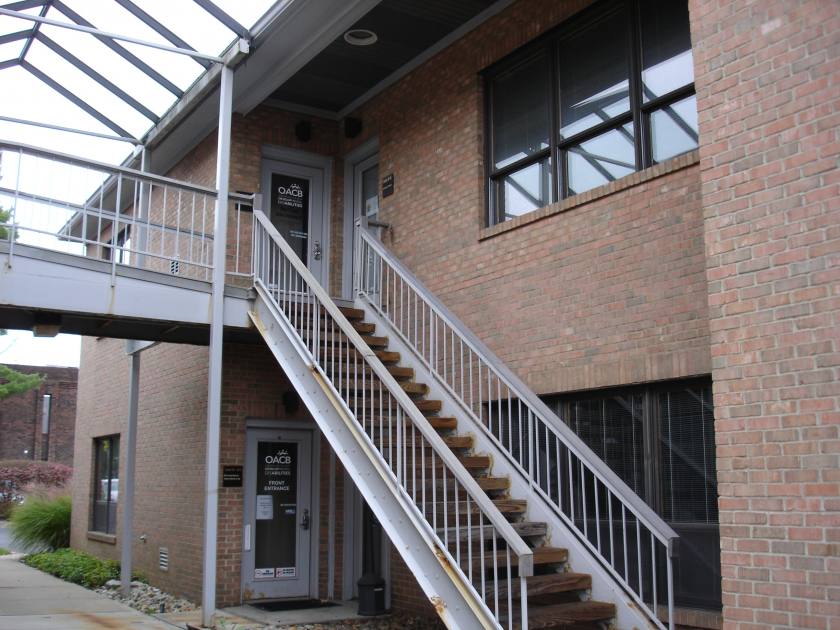
73 East Wilson Bridge Road Worthington, OH 43085
73 East Wilson Bridge Road Worthington, OH 43085
Details & Description
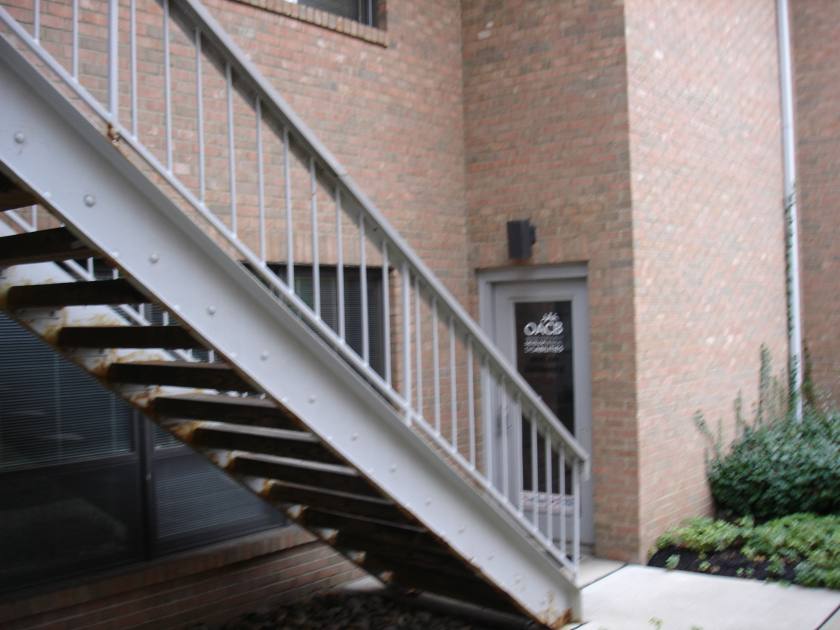
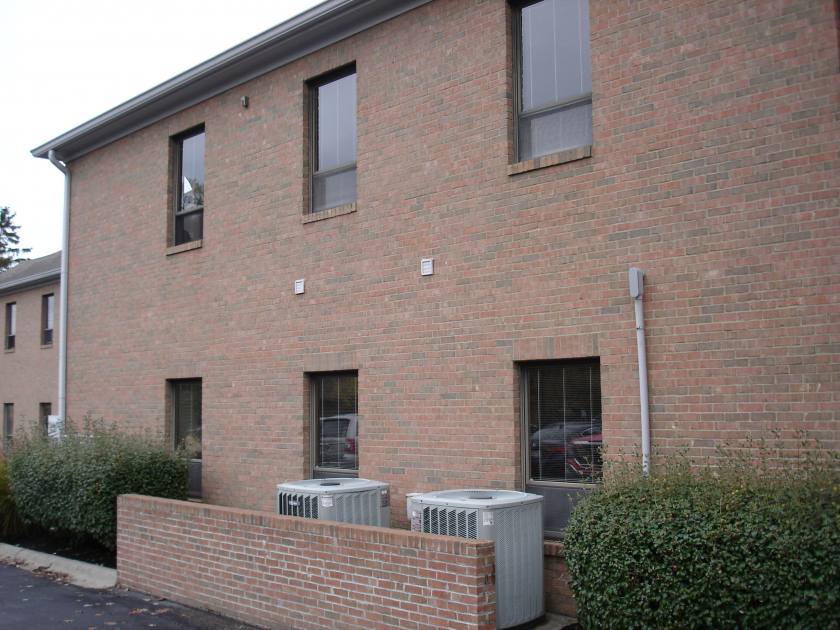
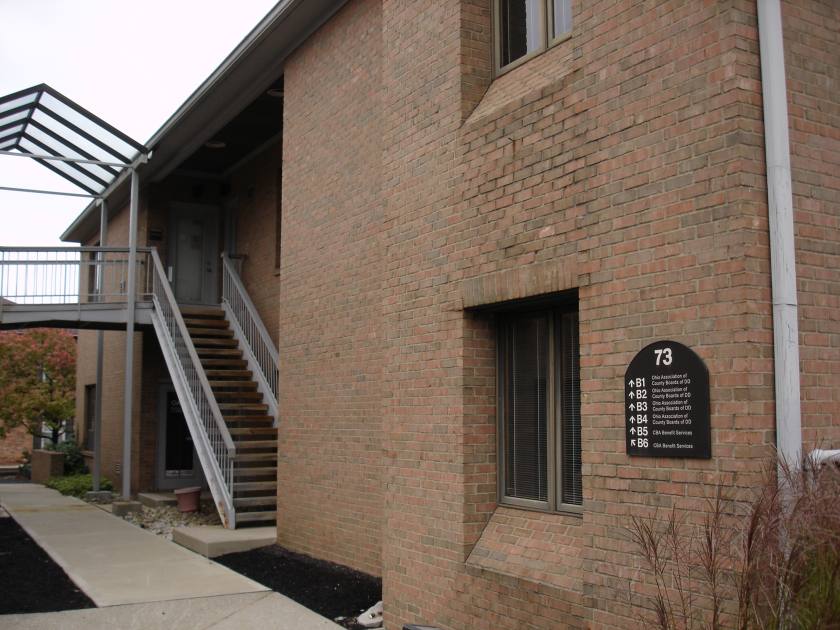
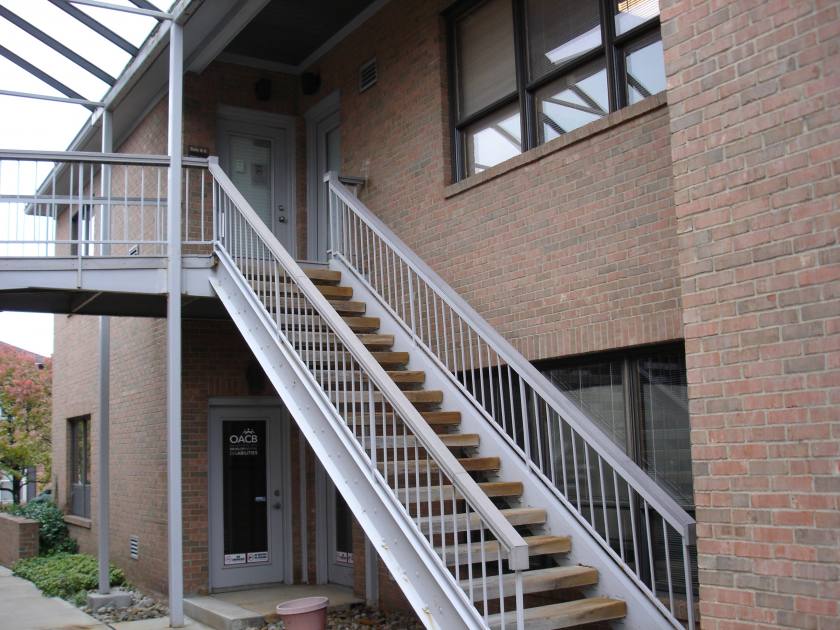
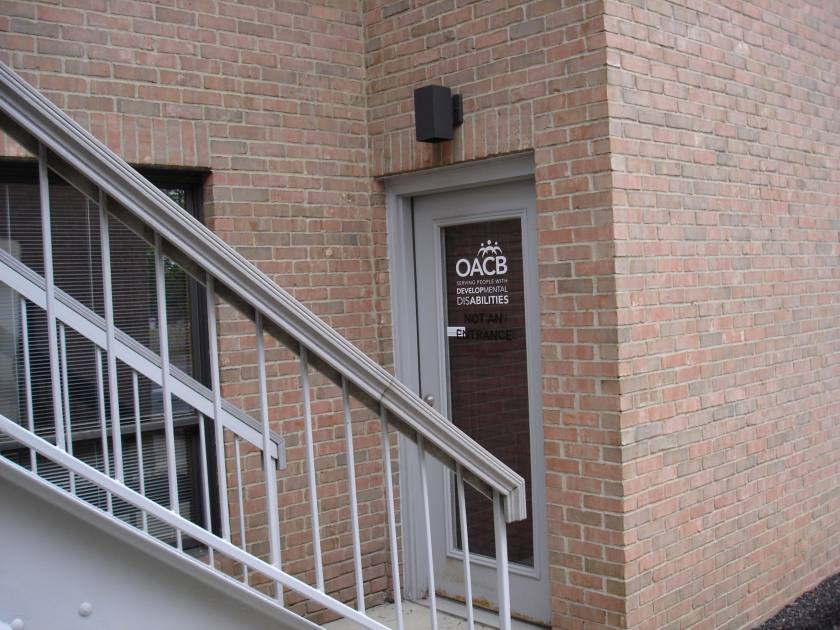
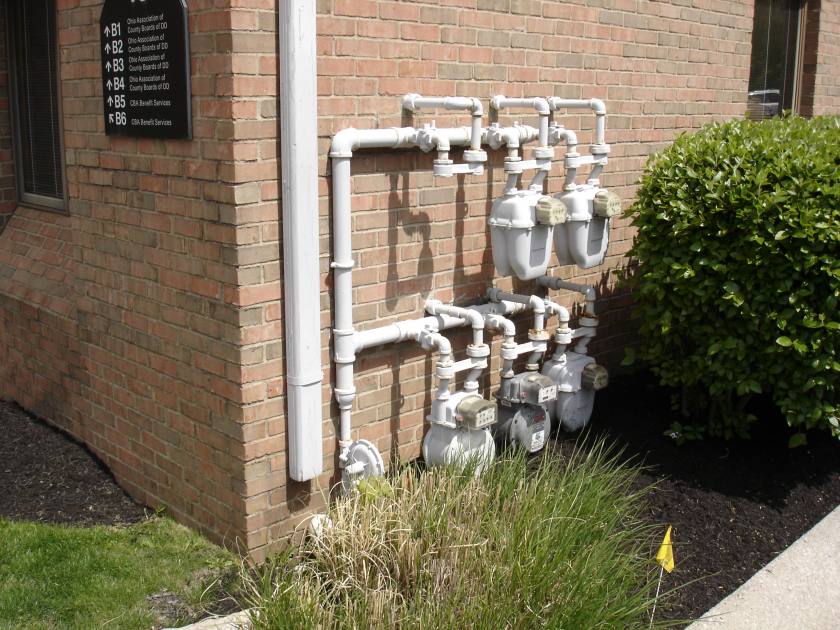
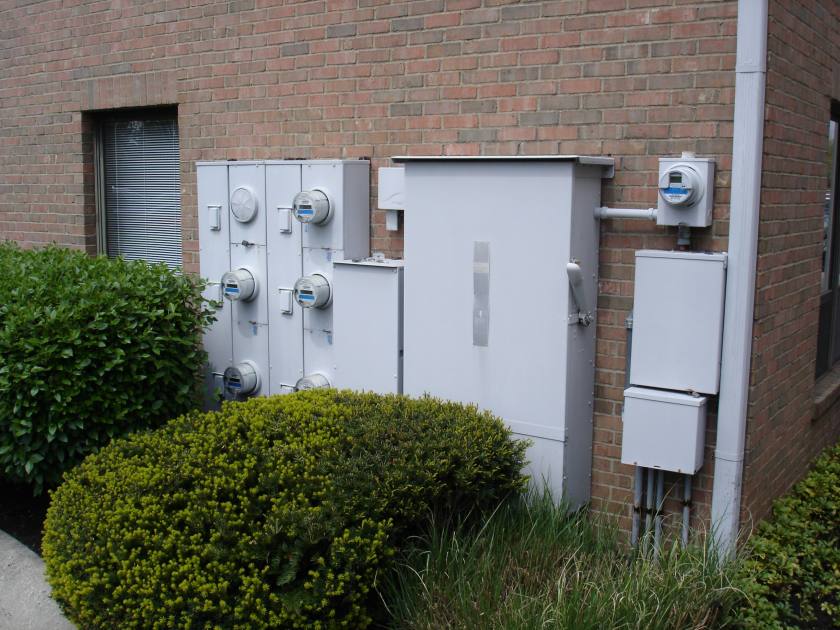
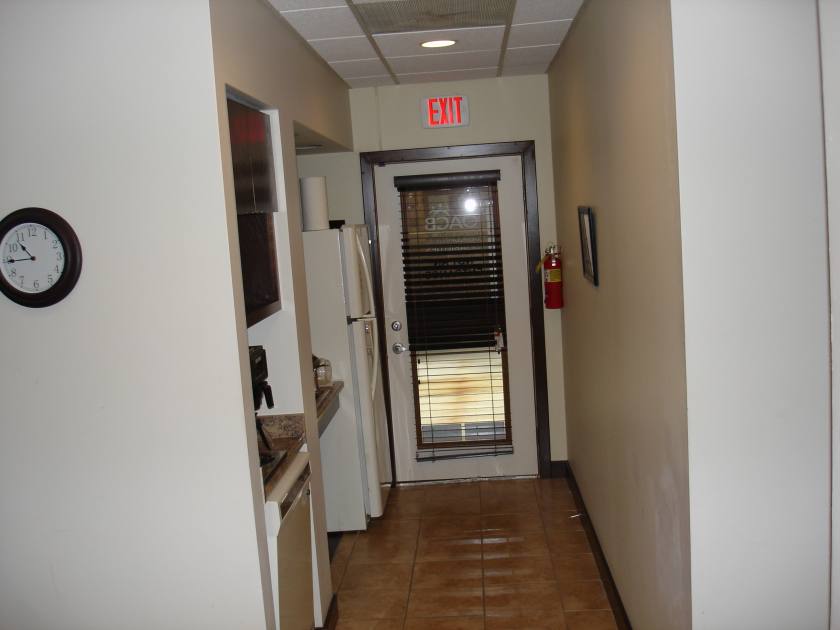
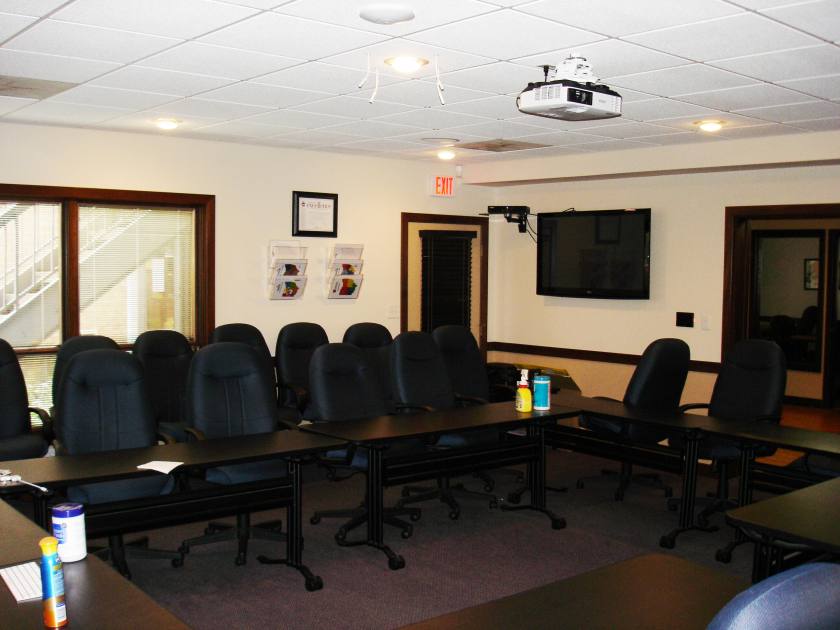
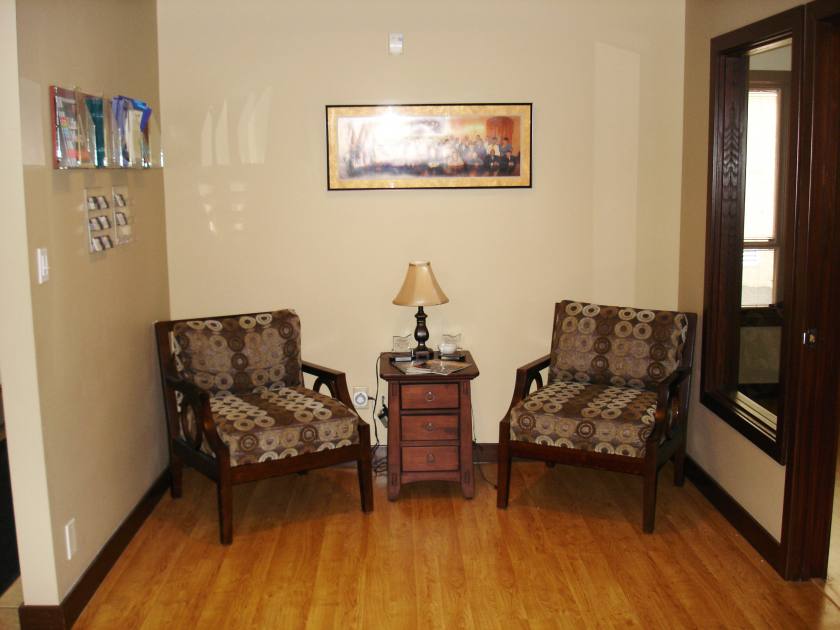
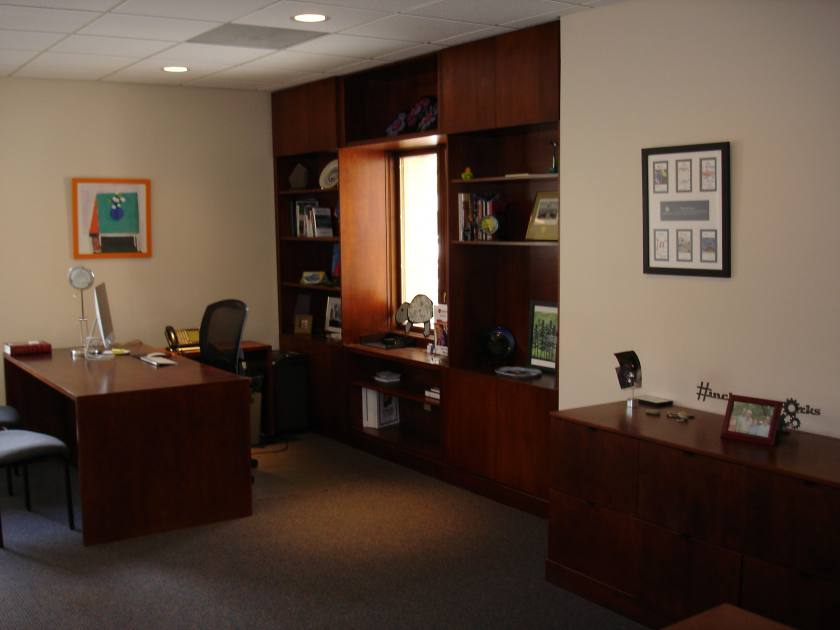
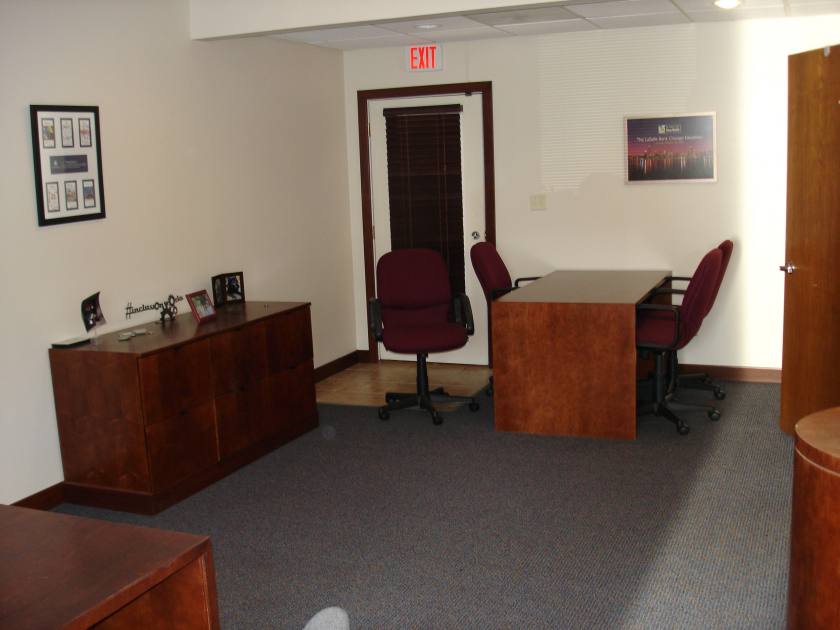
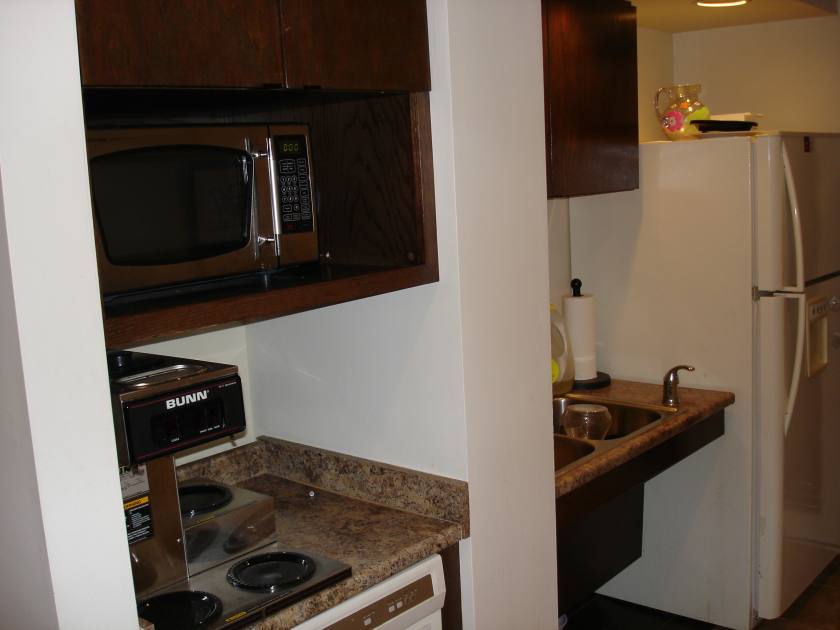
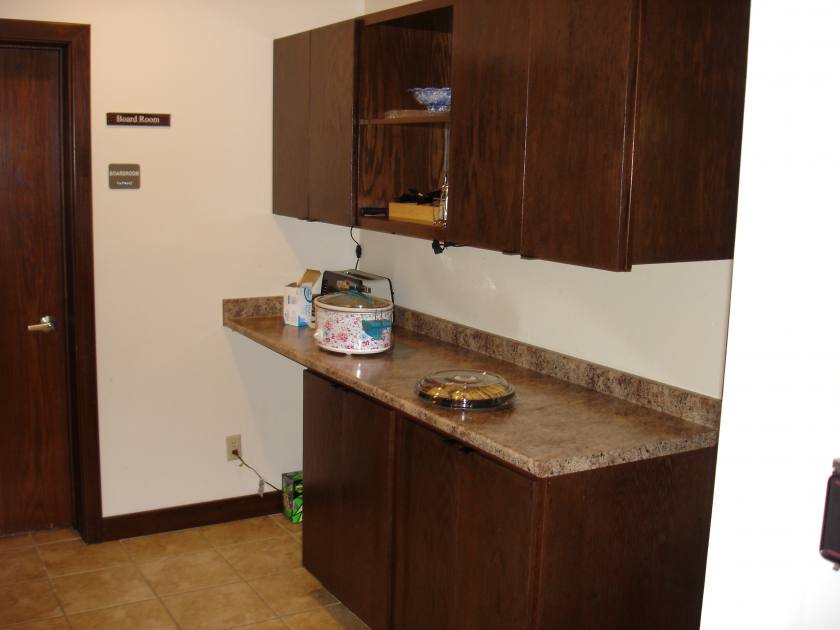
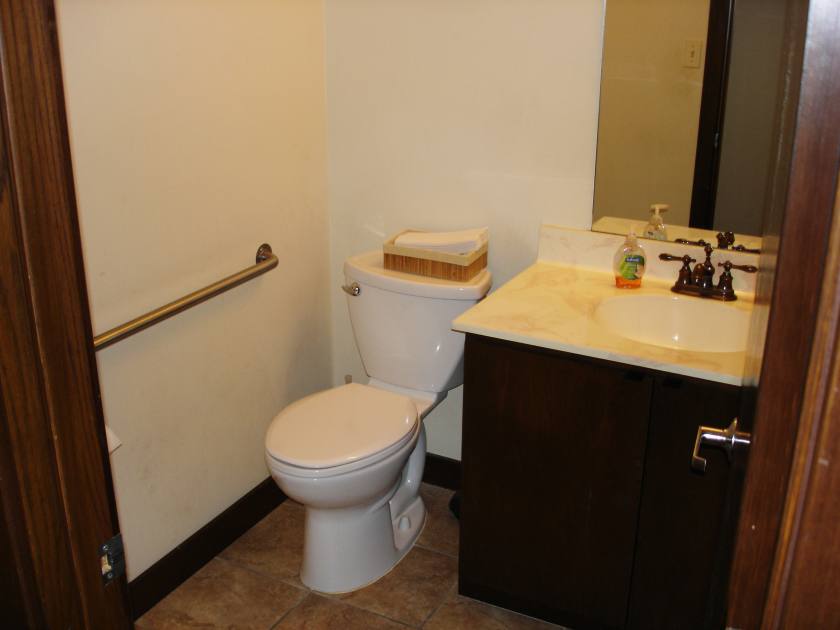
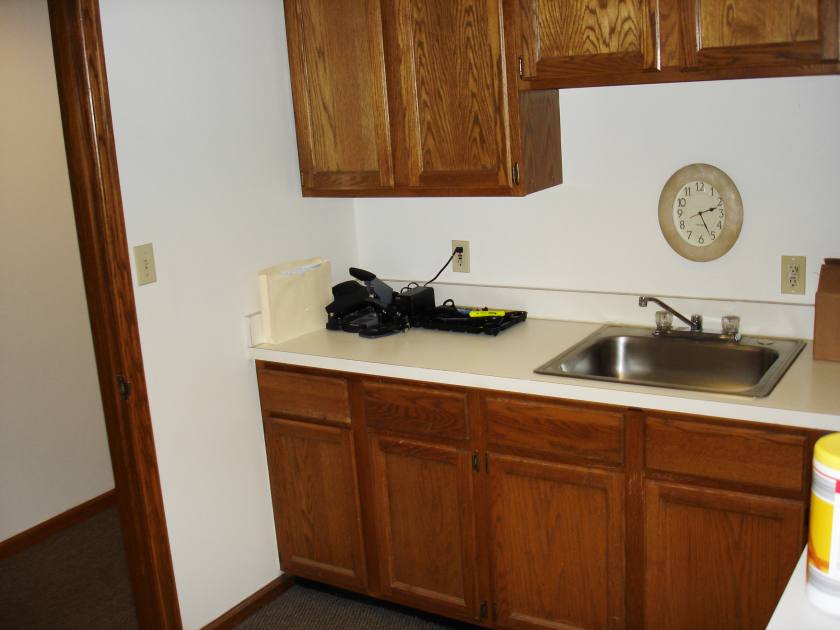
Additional Photos

Listing Agents

Mike Doss
M: 614-915-2624
mdoss@rweiler.com
M: 614-915-2624
mdoss@rweiler.com
While we strive to provide the most accurate information, all listing information, and demographic data, is provided by third-parties. As such, MyEListing will not be responsible for the accuracy of the information. It is strongly recommended that you verify all information with the listing agent, and any relevant agencies, prior to making any decisions.