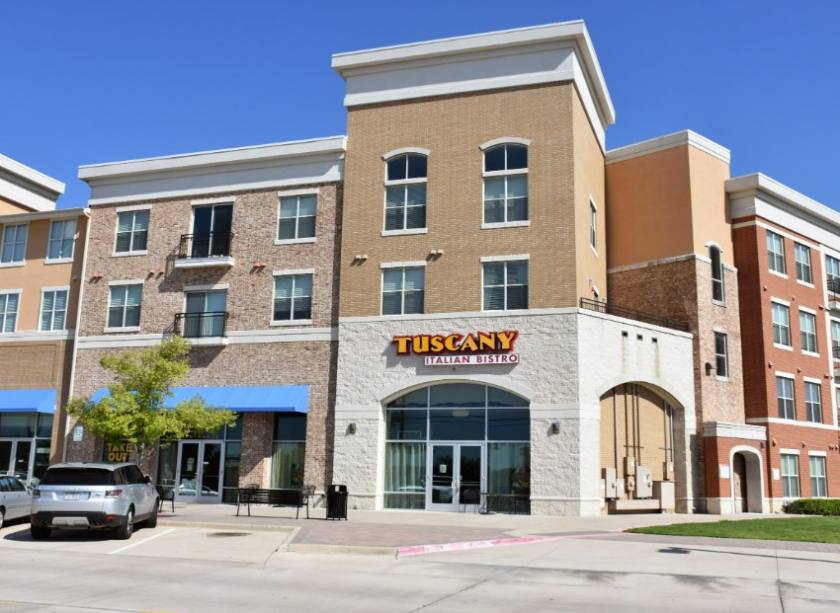
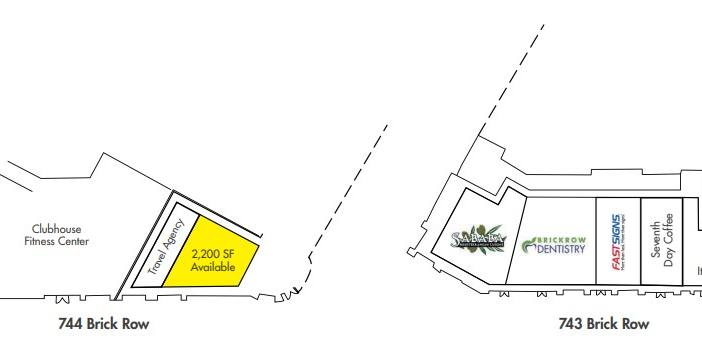
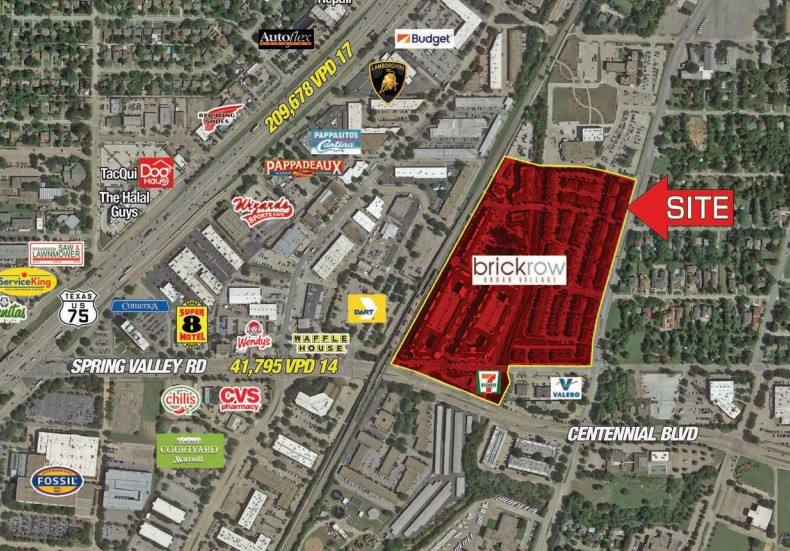
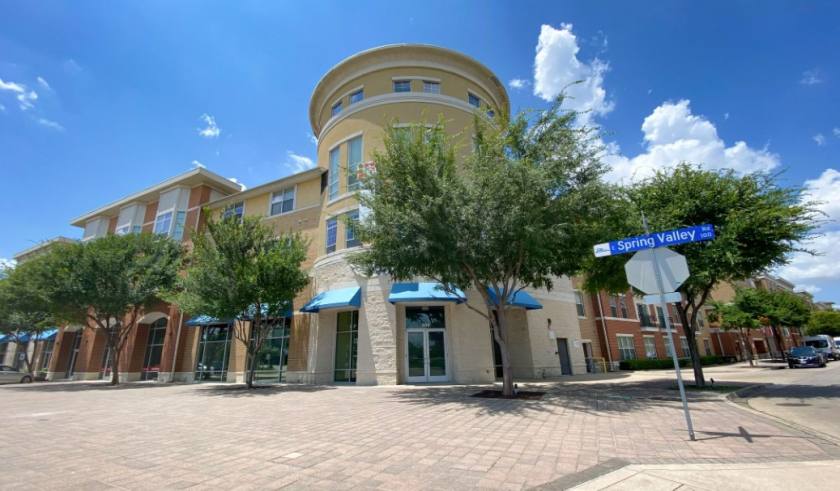
1-Mile | 3-Miles | 5-Miles | ||
---|---|---|---|---|
Total Population | 15,999 | 172,564 | 409,637 | |
Population Median Age | 34 | 35 | 36 | |
Population by Age | 0-9 Yrs | 2380 (14%) | 26975 (15%) | 57280 (13%) |
10-19 Yrs | 2248 (14%) | 21575 (12%) | 47367 (11%) | |
20-29 Yrs | 2890 (18%) | 27008 (15%) | 69837 (17%) | |
30-39 Yrs | 2653 (16%) | 28692 (16%) | 65277 (15%) | |
40-49 Yrs | 1765 (11%) | 21302 (12%) | 50710 (12%) | |
50-59 Yrs | 1880 (11%) | 20094 (11%) | 46088 (11%) | |
60-69 Yrs | 1144 (7%) | 13574 (7%) | 37329 (9%) | |
70+ Yrs | 1038 (6%) | 13344 (7%) | 35750 (8%) | |
Median HH Income | $64,018 | $57,509 | $63,249 | |
Total Household Income | < 24K | 923 (15%) | 12700 (19%) | 26675 (16%) |
25-49K | 1437 (23%) | 15932 (24%) | 38012 (23%) | |
50-74K | 1182 (19%) | 11686 (17%) | 29282 (18%) | |
75-99K | 652 (10%) | 7290 (11%) | 19281 (11%) | |
100-199K | 1572 (25%) | 12991 (19%) | 33905 (20%) | |
200K+ | 296 (4%) | 4667 (7%) | 15382 (9%) | |
Highest Education Level | No Diploma | 985 | 16512 | 35400 |
Diploma or GED | 1645 | 19546 | 44781 | |
Some College | 2202 | 23522 | 54954 | |
Assoc. Degree | 858 | 8643 | 17840 | |
Bachelors Degree | 2881 | 27869 | 74747 | |
Higher Degree | 1463 | 15357 | 46110 | |
Total Housing Units | 6,420 | 71,750 | 179,335 | |
--Owner-Occupied | 2,260 | 25,965 | 68,975 | |
--Renter-Occupied | 3,802 | 39,301 | 93,562 | |
Owner-Occupied Values | < 100K | 106 | 1752 | 3544 |
100-199K | 507 | 6522 | 16578 | |
200-299K | 893 | 7468 | 15825 | |
300-399K | 565 | 5143 | 11852 | |
400-499K | 114 | 2226 | 7624 | |
500K+ | 75 | 2854 | 13552 | |
Total Working Age Population | 12,327 | 132,584 | 323,834 | |
In Work Force | 8,555 | 93,311 | 230,022 | |
Not In Work Force | 3,771 | 39,273 | 93,812 | |
Workforce Employed | 8,216 | 88,600 | 218,662 | |
Workforce Unemployed | 333 | 4,640 | 11,197 | |
Civlian Workforce | 8,549 | 93,240 | 229,859 | |
Military Workforce | 6 | 71 | 163 | |
Total Households | 6,061 | 65,266 | 162,537 | |
Family Households | 3,483 | 39,667 | 95,575 | |
Non-Family Households | 2,578 | 25,599 | 66,963 | |
Married Couple | 2,260 | 27,084 | 67,656 | |
Other Family | 1,223 | 12,582 | 27,919 | |
Married w/Child | 1,290 | 12,933 | 30,247 | |
Single Male w/Child | 147 | 1,816 | 3,878 | |
Single Female w/Child | 509 | 4,962 | 10,592 |
Population Change Last Two Decades - Plus Projection
2000 | % | 2010 | % | 2020 | % | 2030 | |
---|---|---|---|---|---|---|---|
Texas | 20,851,820 | +21 | 25,145,561 | +18 | 29,677,668 | +18 | 34,894,452 |
Collin County | 491,675 | +59 | 782,341 | +33 | 1,039,369 | +34 | 1,391,461 |
Dallas County | 2,218,899 | +7 | 2,368,139 | +15 | 2,734,111 | +14 | 3,106,298 |
Total Working Age Population:
Total Households:
Total Working Age Population:
Total Households:
Total Working Age Population:
Total Households: