Retail Space
1301 - 1469 W Campbell Rd Richardson, TX 75080
1301 - 1469 W Campbell Rd Richardson, TX 75080
Details & Description
Property Highlights
• Located less than one mile from the University of Texas at Dallas, a 455-acre campus with 30,000 students
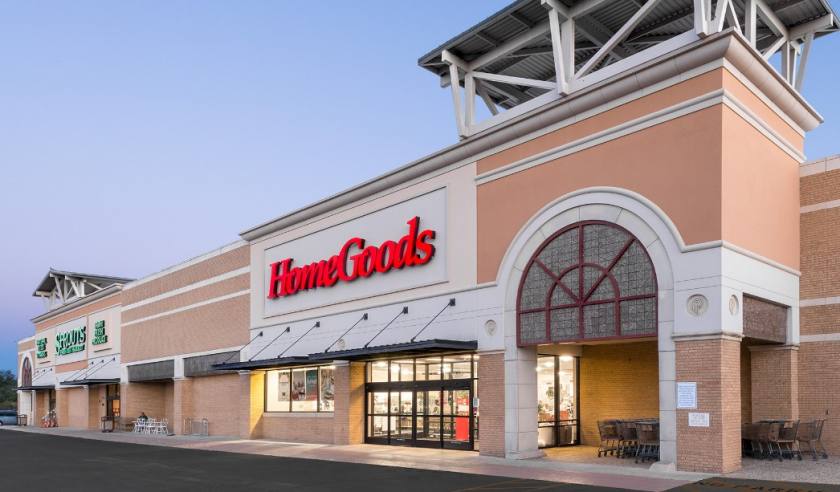
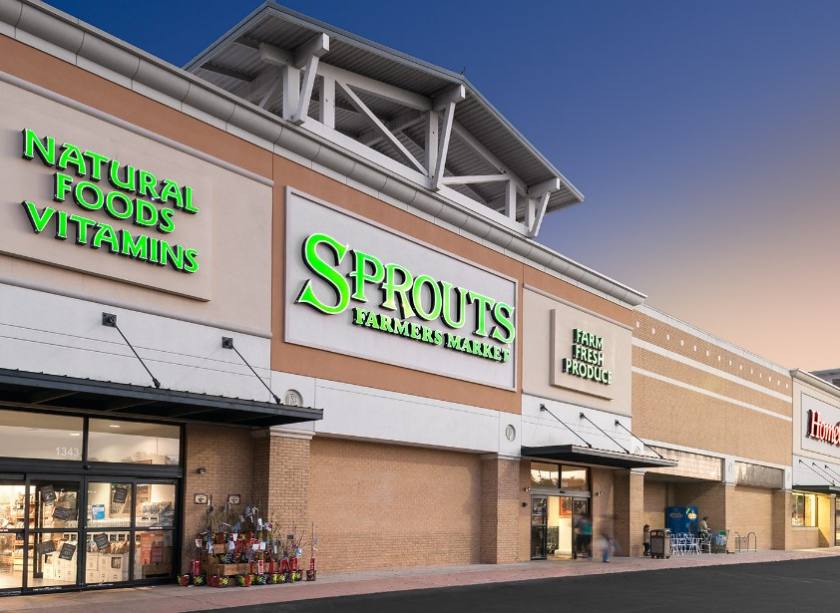
• High-traffic generating anchors - Sprouts, HomeGoods, Barnes & Noble and Bike Mart.
Additional Photos


Listing Agents

James Cagle
M: 972-764-5402
jcagle@inroadsrealty.com
M: 972-764-5402
jcagle@inroadsrealty.com

Mike Cagle
M: 972-764-6001
mcagle@inroadsrealty.com
M: 972-764-6001
mcagle@inroadsrealty.com
While we strive to provide the most accurate information, all listing information, and demographic data, is provided by third-parties. As such, MyEListing will not be responsible for the accuracy of the information. It is strongly recommended that you verify all information with the listing agent, and any relevant agencies, prior to making any decisions.