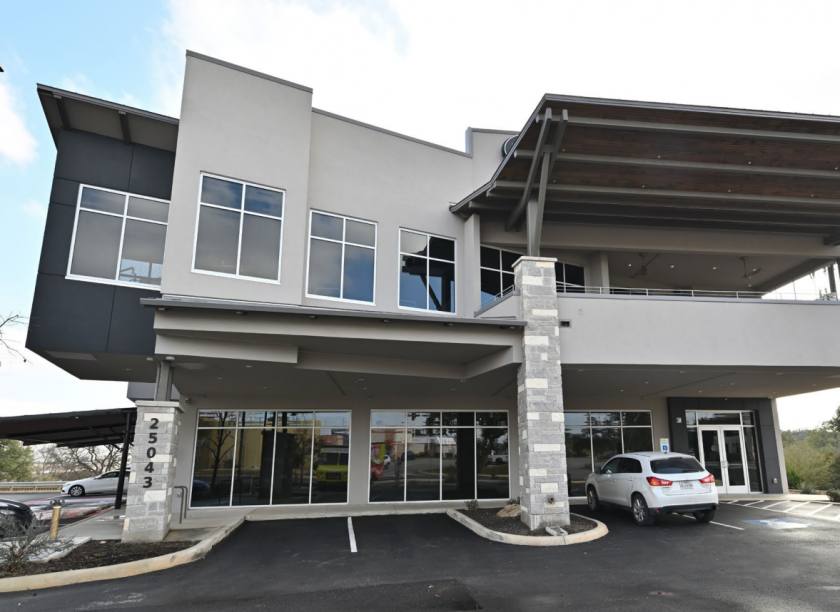
Office Space
25043 I-10 West San Antonio, TX 78257
25043 I-10 West San Antonio, TX 78257
Details & Description
Property Highlights
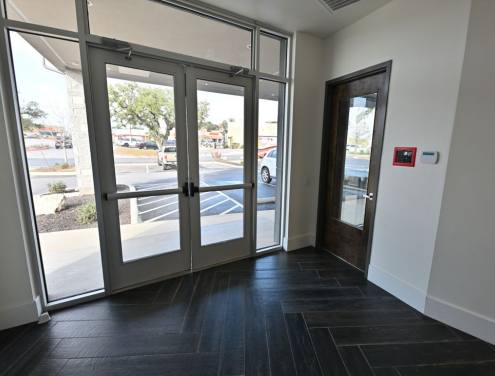
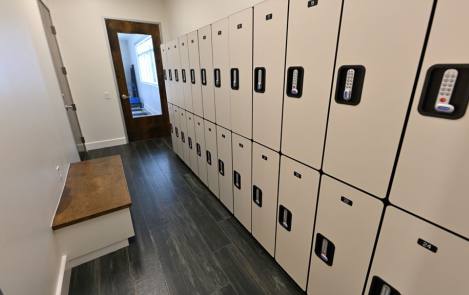
- • High-end common area finishes
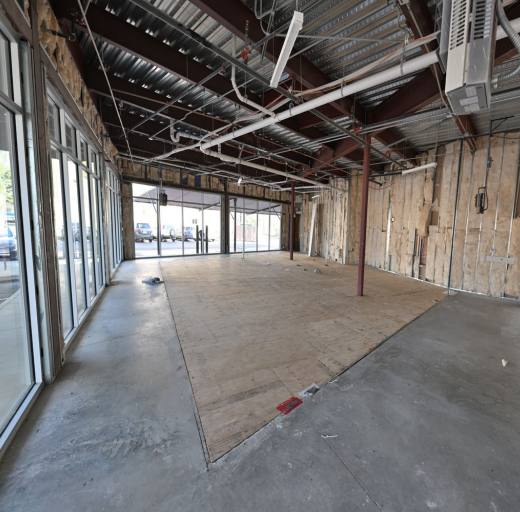
- • Shell space condition
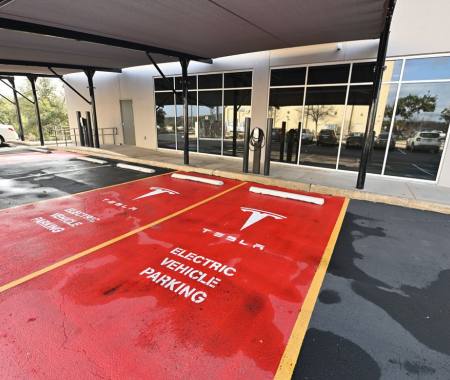
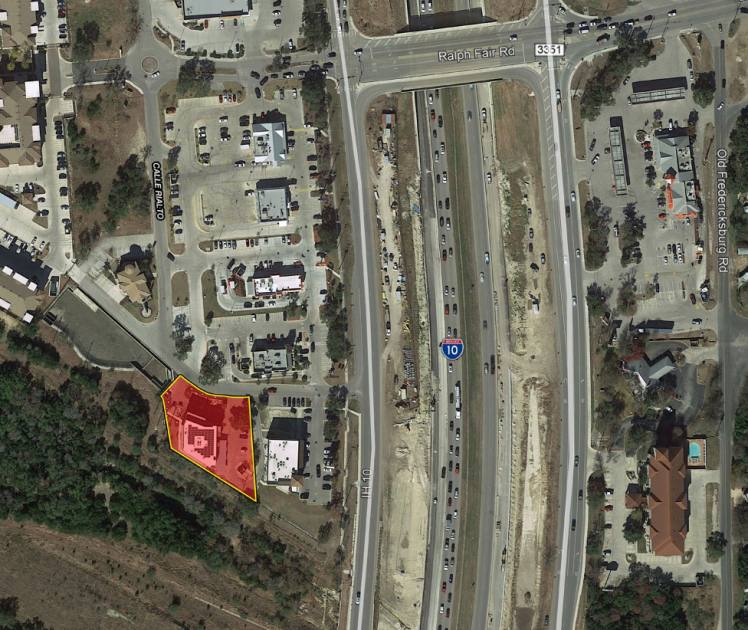
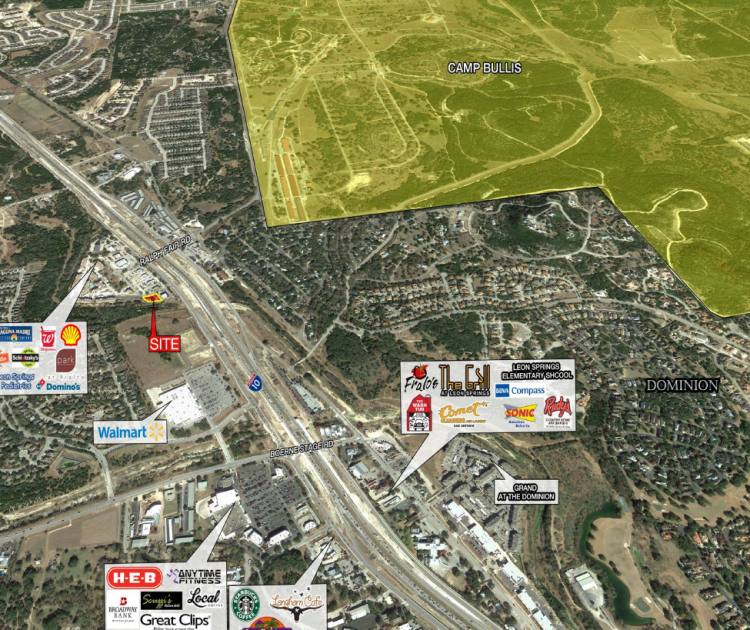
- • Great I-10 frontage visibility
- • Direct access to I-10
- • Near major I-10 intersection: Ralph Fair and I-10
- • Pylon signage, building signage available
Additional Photos


Listing Agents

Andrew Lyles
O: 210-524-4000
M: 210-524-1306
alyles@reocsanantonio.com
O: 210-524-4000
M: 210-524-1306
alyles@reocsanantonio.com
While we strive to provide the most accurate information, all listing information, and demographic data, is provided by third-parties. As such, MyEListing will not be responsible for the accuracy of the information. It is strongly recommended that you verify all information with the listing agent, and any relevant agencies, prior to making any decisions.