Office Space
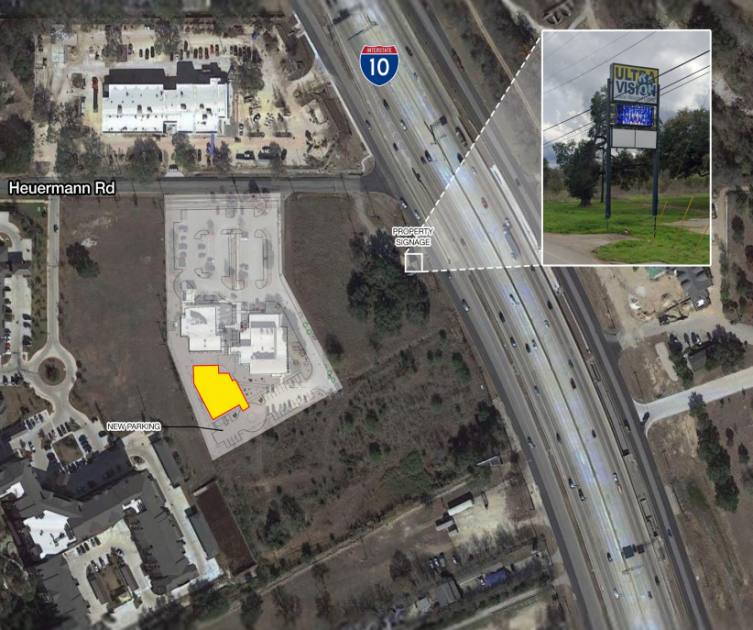
6818 Heuermann Road San Antonio, TX 78256
6818 Heuermann Road San Antonio, TX 78256

Details & Description
Property Highlights
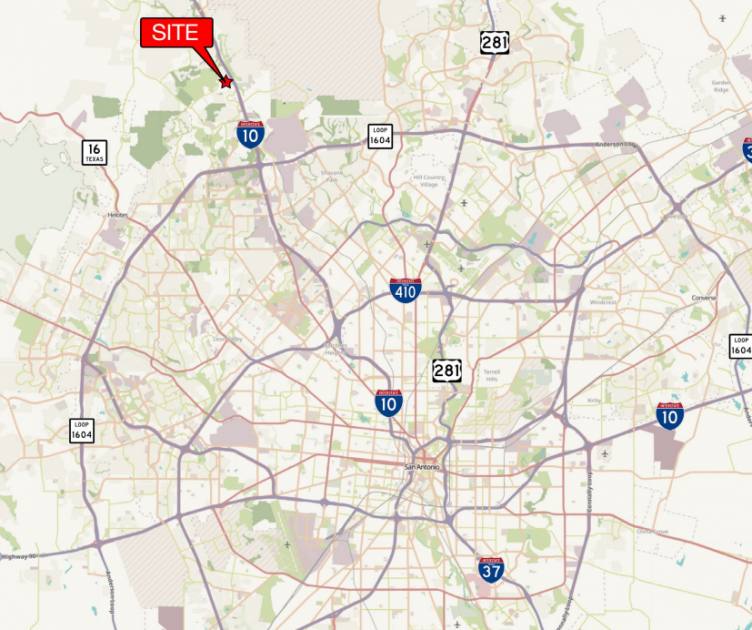
• Located near affluent neighborhoods of The Dominion, Fair Oaks Ranch, and Anaqua Springs
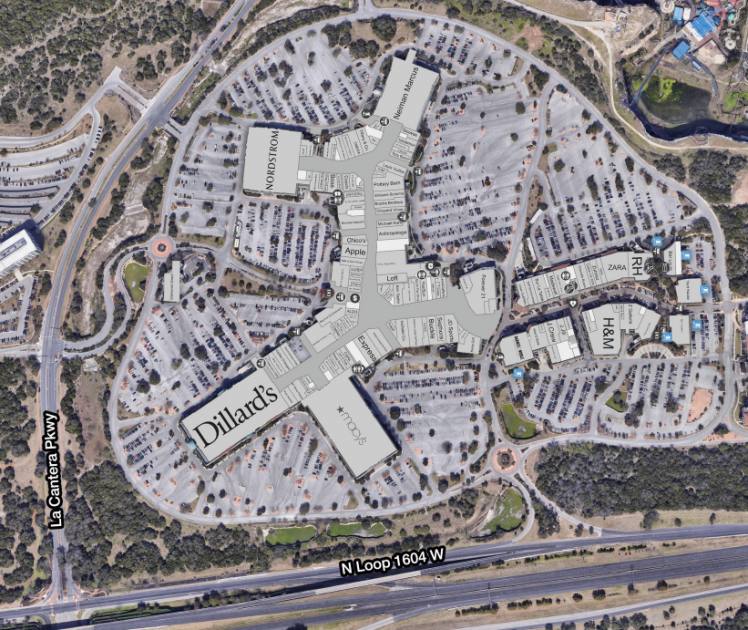
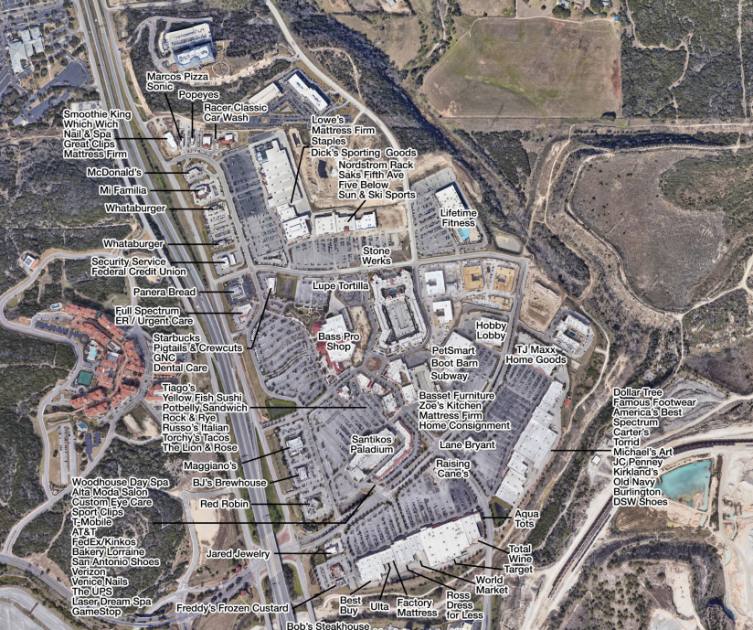
• Close proximity to UTSA, the RIM, The Shops at La Cantera, and Six Flags Fiesta Texas
Additional Photos
Listing Agents

Andrew Lyles
O: 210-524-4000
M: 210-524-1306
alyles@reocsanantonio.com
O: 210-524-4000
M: 210-524-1306
alyles@reocsanantonio.com
While we strive to provide the most accurate information, all listing information, and demographic data, is provided by third-parties. As such, MyEListing will not be responsible for the accuracy of the information. It is strongly recommended that you verify all information with the listing agent, and any relevant agencies, prior to making any decisions.