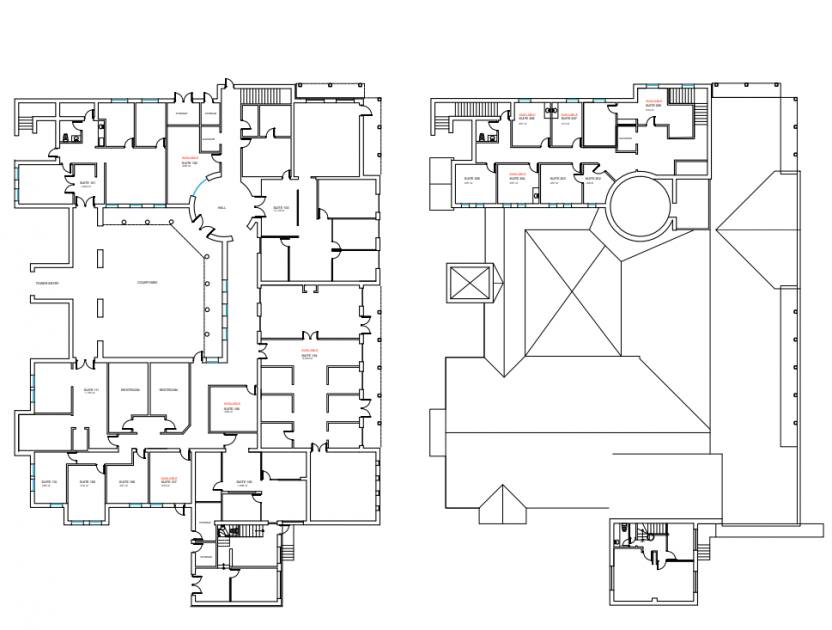
Office Space
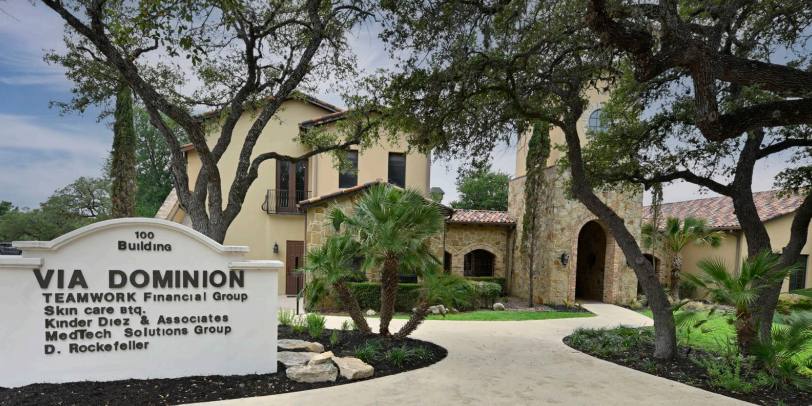
8 Dominion Drive San Antonio, TX 78257
8 Dominion Drive San Antonio, TX 78257
Details & Description
Property Highlights
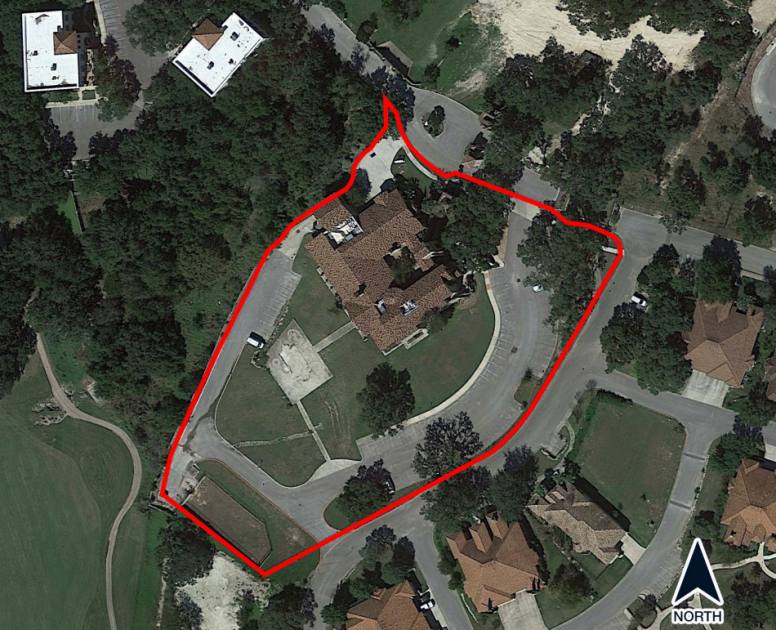
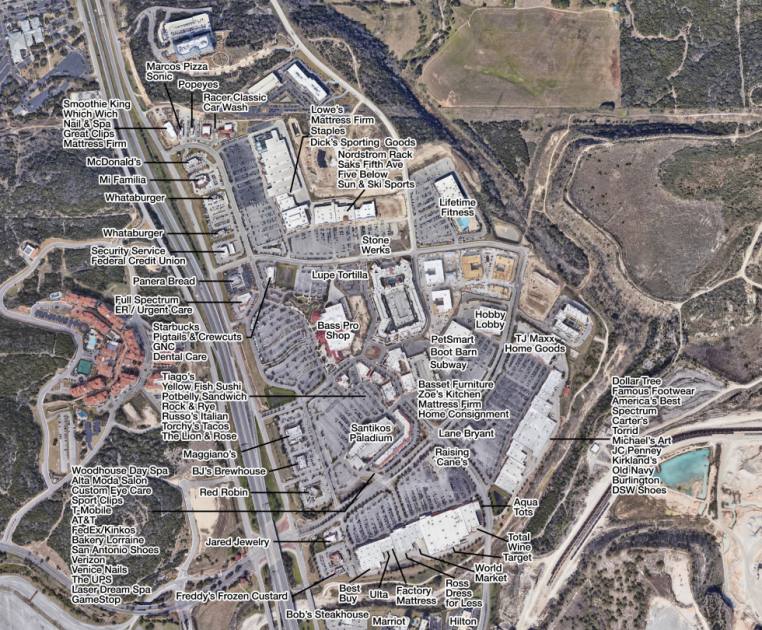
- • Easy accessibility off IH-10
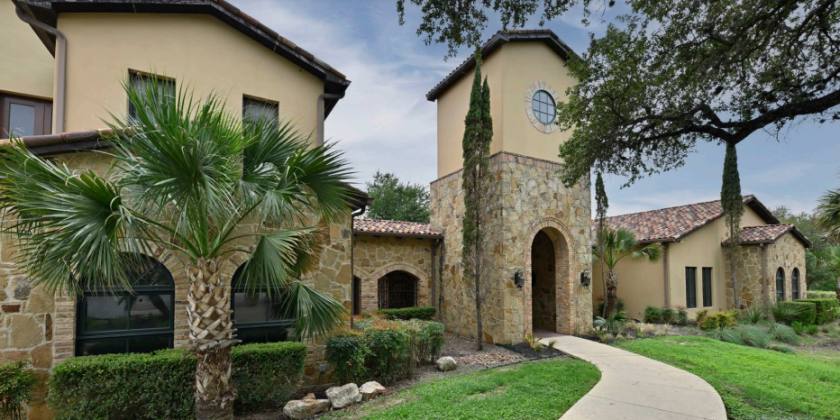
- • Golf course view
- • Gated security with after hours access card
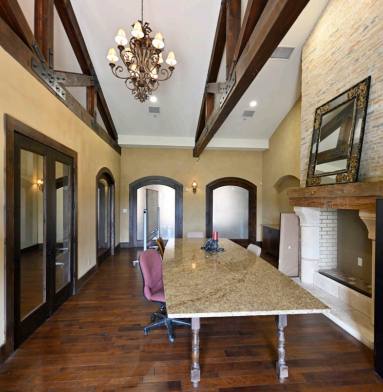
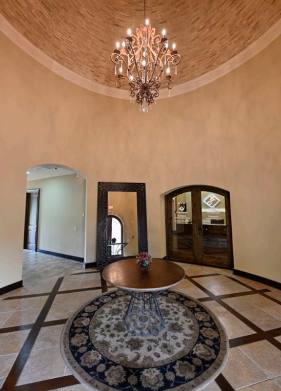
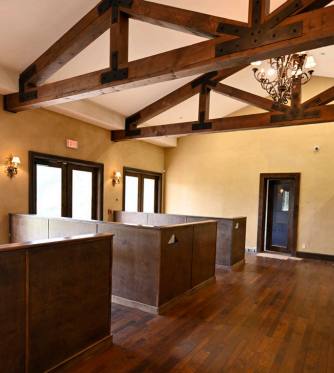
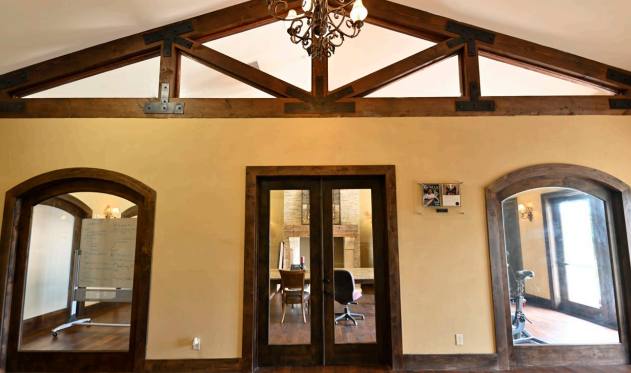
- • Class A office building with 12 ft ceilings
- • Directly adjacent to The Dominion
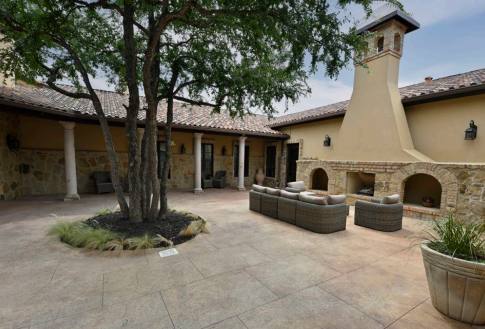
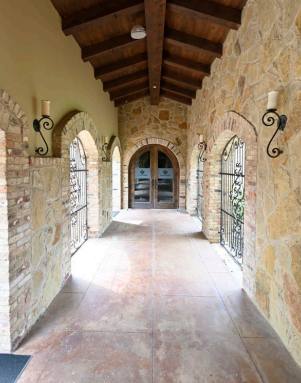
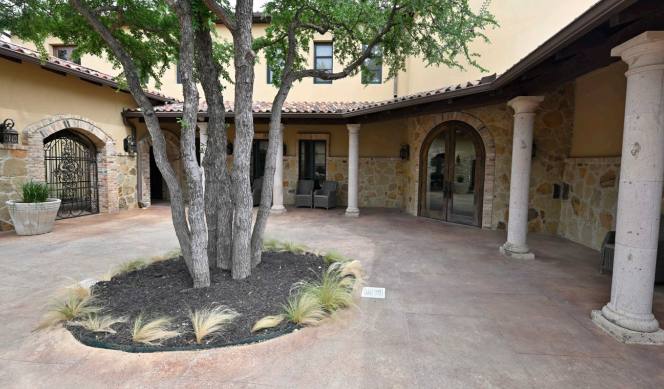
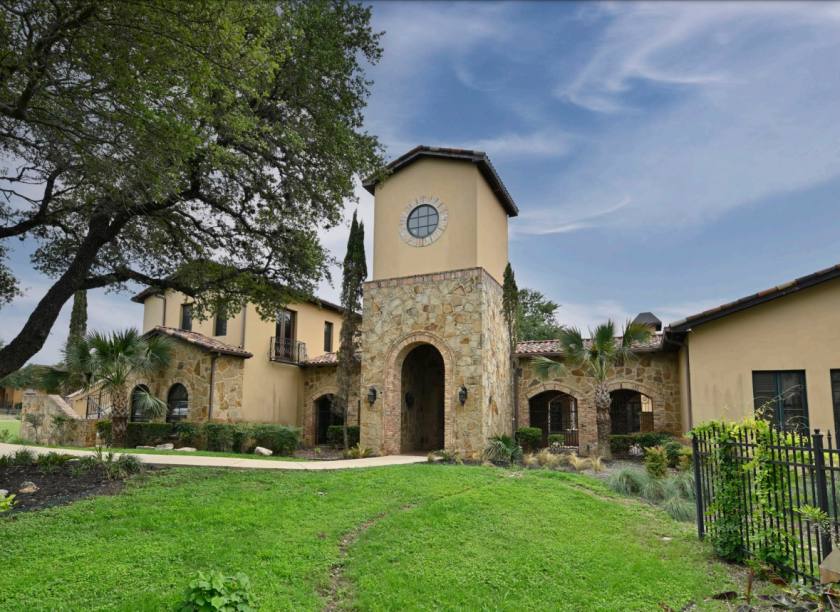
Additional Photos


Listing Agents

Andrew Lyles
O: 210-524-4000
M: 210-524-1306
alyles@reocsanantonio.com
O: 210-524-4000
M: 210-524-1306
alyles@reocsanantonio.com

Kimberly Gatley
O: 210-524-4000
M: 210-524-1320
kgatley@reocsanantonio.com
O: 210-524-4000
M: 210-524-1320
kgatley@reocsanantonio.com
While we strive to provide the most accurate information, all listing information, and demographic data, is provided by third-parties. As such, MyEListing will not be responsible for the accuracy of the information. It is strongly recommended that you verify all information with the listing agent, and any relevant agencies, prior to making any decisions.