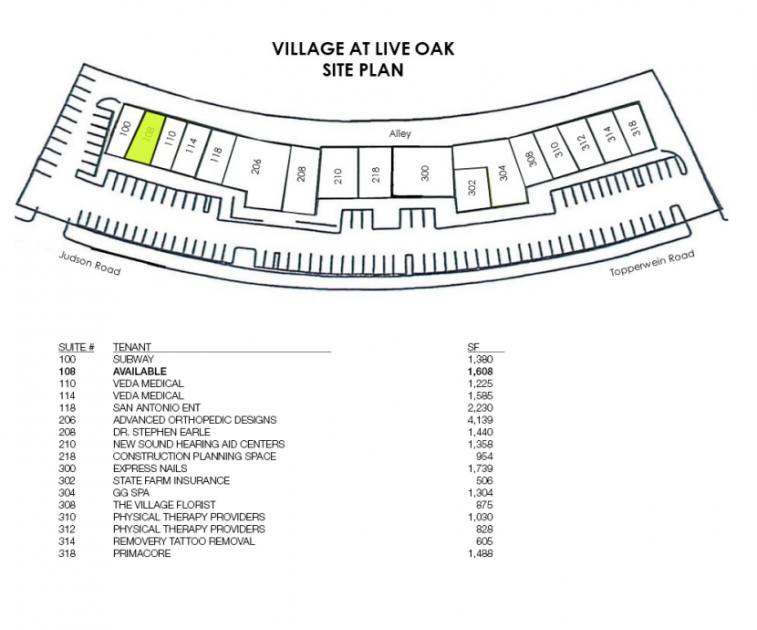
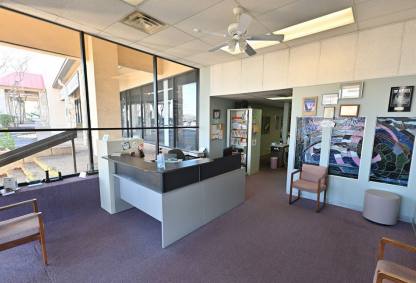
Office Space
12315 Judson Road San Antonio, TX 78233
12315 Judson Road San Antonio, TX 78233
Details & Description
Property Highlights
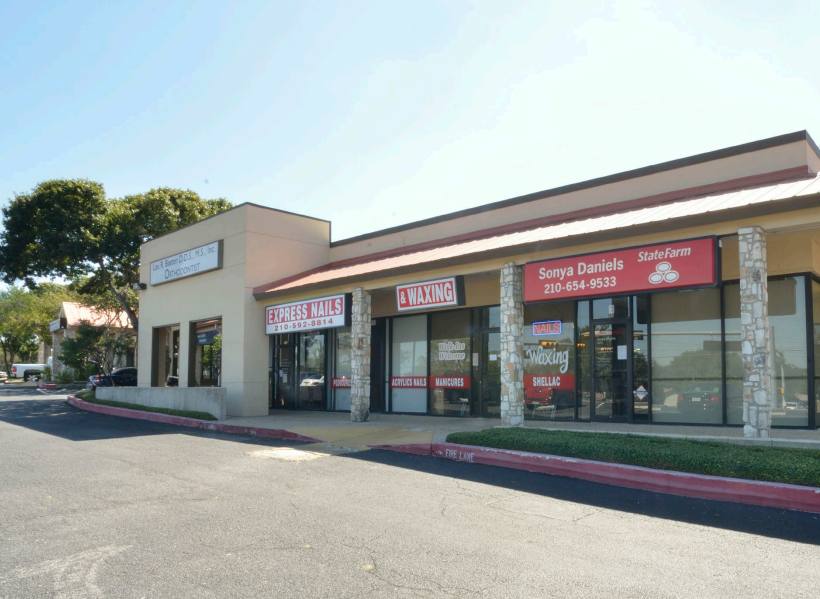
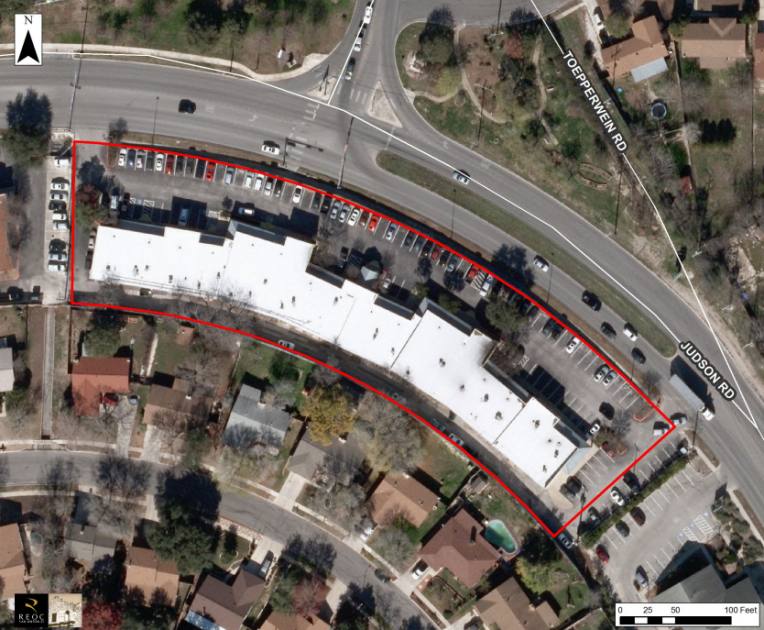
- • Excellent visibility
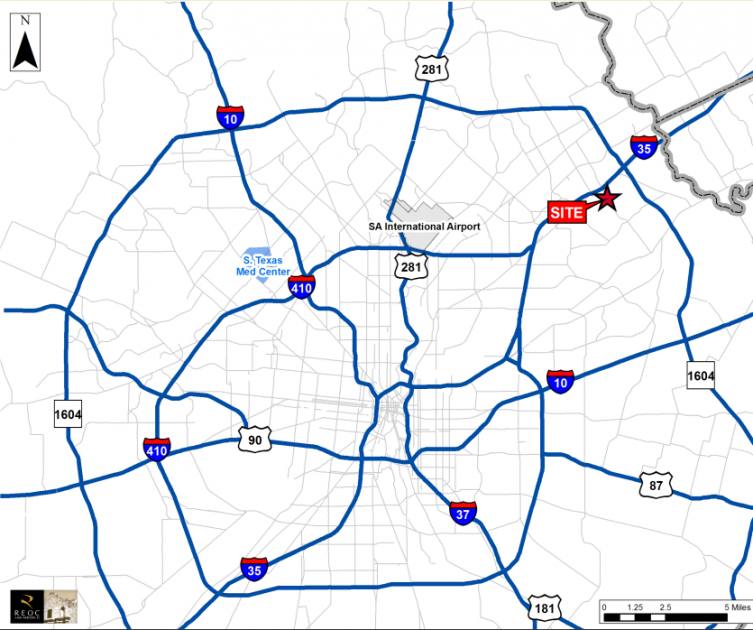
- • Easy access to IH-35, Loop 1604, and Loop 410
- • Easy ingress/egress to adjacent thoroughfares
- • Pylon signage available
- • Enjoys strong demographics
- • Professionally managed
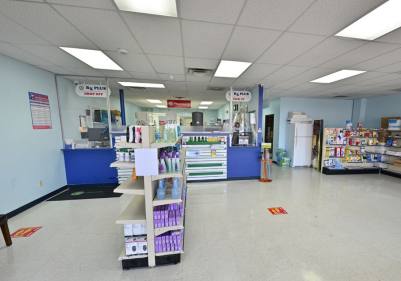
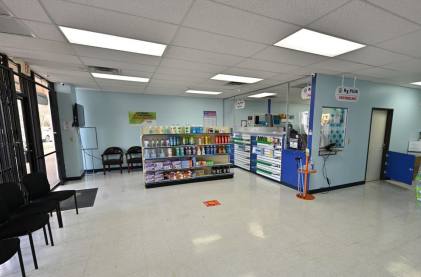
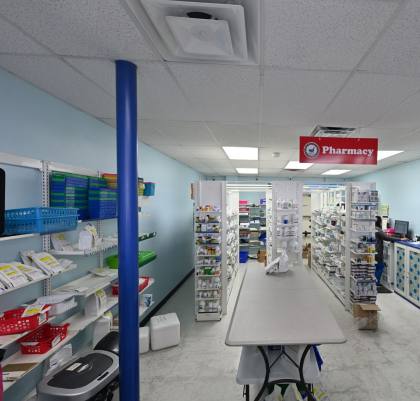
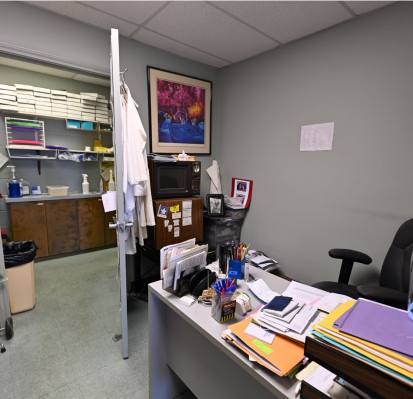
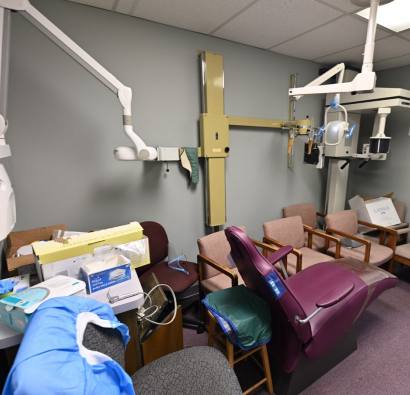
Additional Photos


Listing Agents

Blake McFarlane Bonner
O: 210-524-4000
M: 210-524-1305
bbonner@reocsanantonio.com
O: 210-524-4000
M: 210-524-1305
bbonner@reocsanantonio.com

Michael Morse
O: 210-524-4000
M: 210-524-1312
mmorse@reocsanantonio.com
O: 210-524-4000
M: 210-524-1312
mmorse@reocsanantonio.com
While we strive to provide the most accurate information, all listing information, and demographic data, is provided by third-parties. As such, MyEListing will not be responsible for the accuracy of the information. It is strongly recommended that you verify all information with the listing agent, and any relevant agencies, prior to making any decisions.