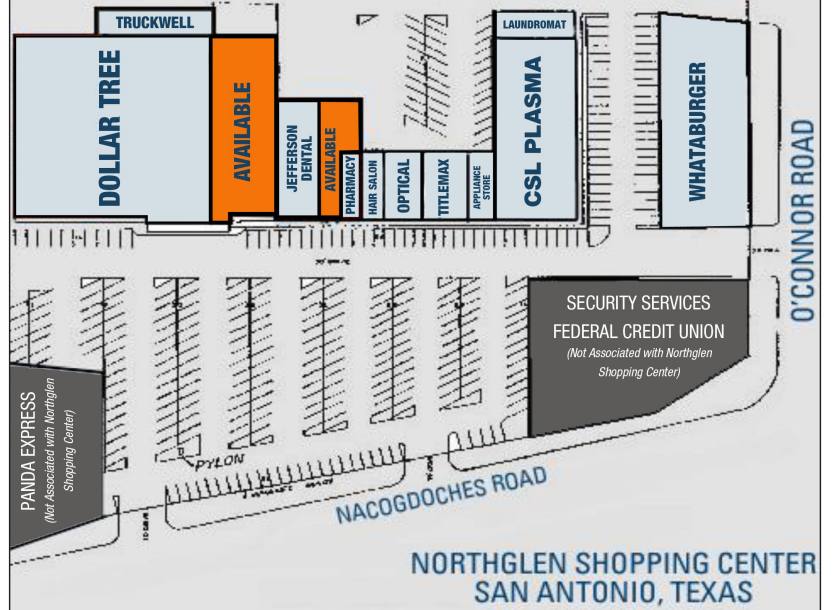
Retail Space
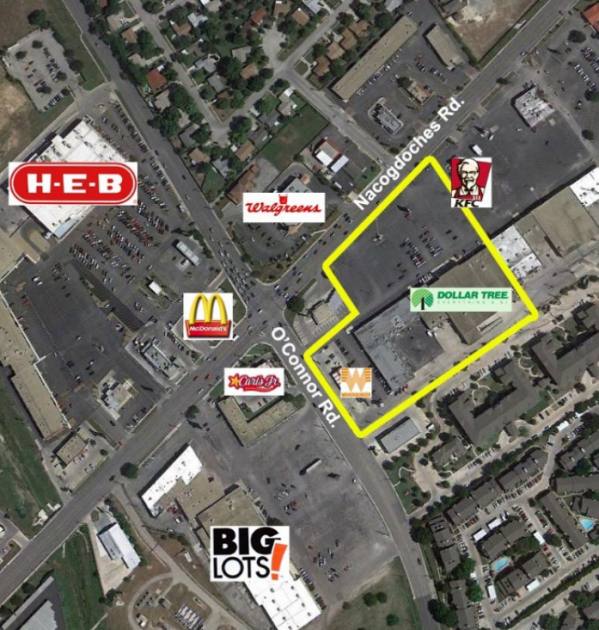
13904 - 14038 Nacogdoches Rd San Antonio, TX 78217
13904 - 14038 Nacogdoches Rd San Antonio, TX 78217
Details & Description
Property Highlights
• Shared intersection with HEB, Big Lots, McDonald’s, Ross Dress for Less, Walgreens among others
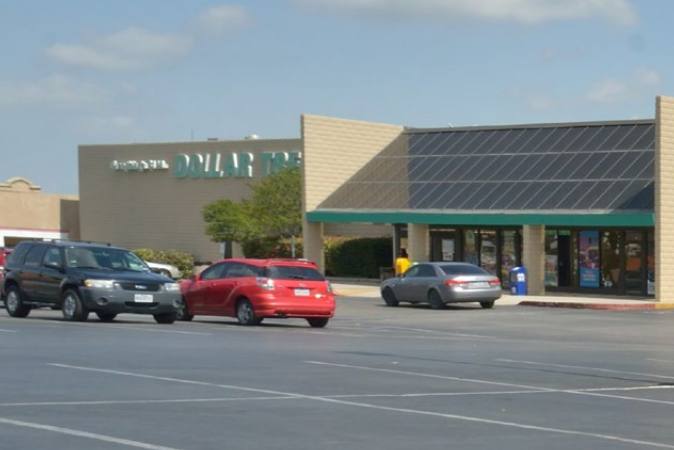
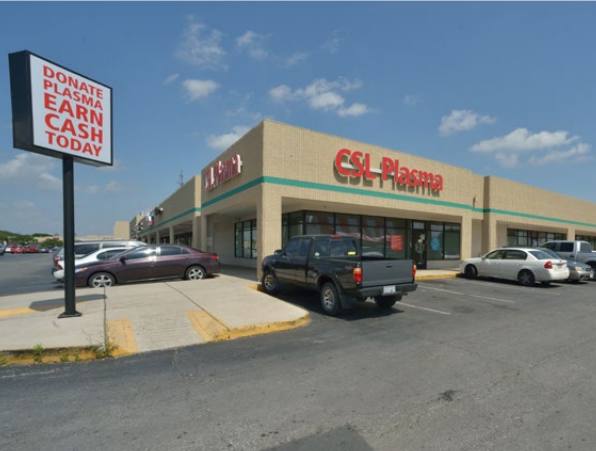
• Neighboring tenants include Dollar Tree, CSL Plasma, Pump It Up, Panda Express and many others
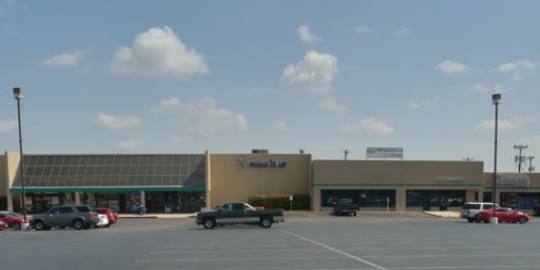
Additional Photos
Listing Agents

Cynthia Ellison
O: 210-524-4000
M: 210-524-1318
cellison@reocsanantonio.com
O: 210-524-4000
M: 210-524-1318
cellison@reocsanantonio.com
While we strive to provide the most accurate information, all listing information, and demographic data, is provided by third-parties. As such, MyEListing will not be responsible for the accuracy of the information. It is strongly recommended that you verify all information with the listing agent, and any relevant agencies, prior to making any decisions.


