Retail Space
16535 Huebner Road San Antonio, TX 78248
16535 Huebner Road San Antonio, TX 78248

Details & Description
Property Highlights
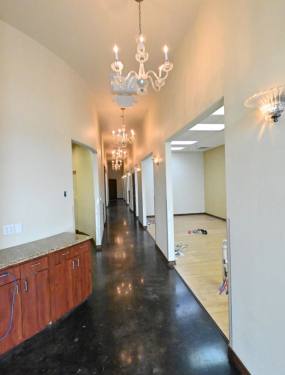
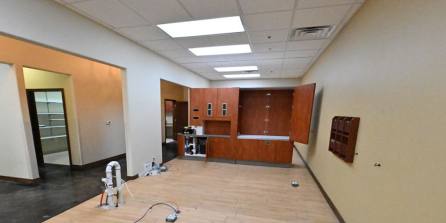
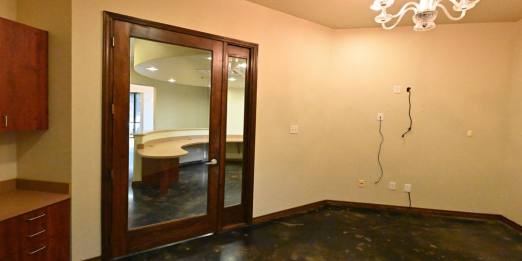
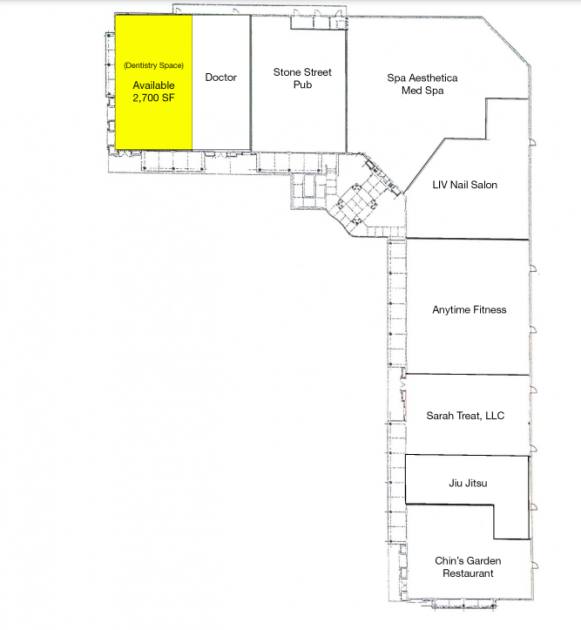
- • Second generation dental space
- • Perfect for retail, medical or office users
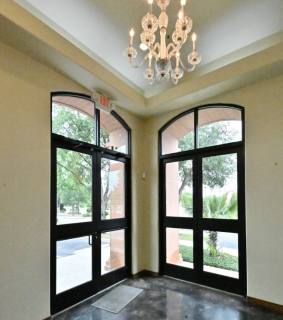
- • Beautiful architecture and design
Additional Photos


Listing Agents

Cynthia Ellison
O: 210-524-4000
M: 210-524-1318
cellison@reocsanantonio.com
O: 210-524-4000
M: 210-524-1318
cellison@reocsanantonio.com
While we strive to provide the most accurate information, all listing information, and demographic data, is provided by third-parties. As such, MyEListing will not be responsible for the accuracy of the information. It is strongly recommended that you verify all information with the listing agent, and any relevant agencies, prior to making any decisions.