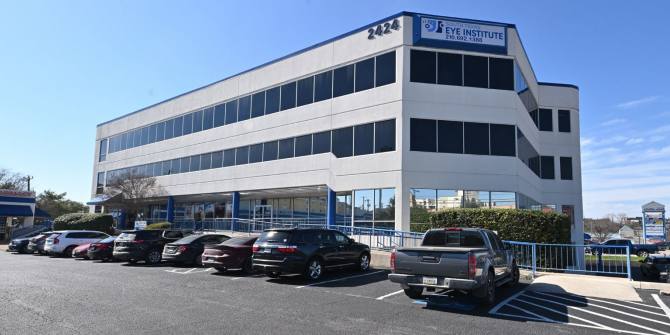
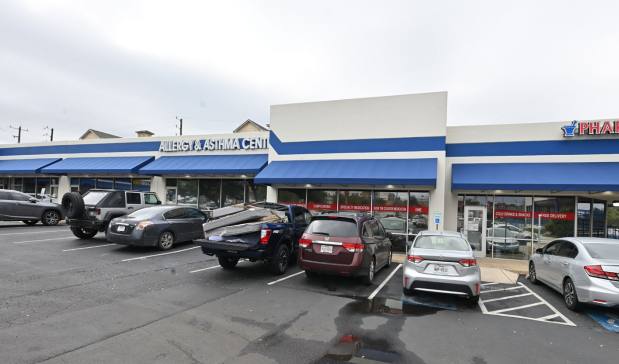
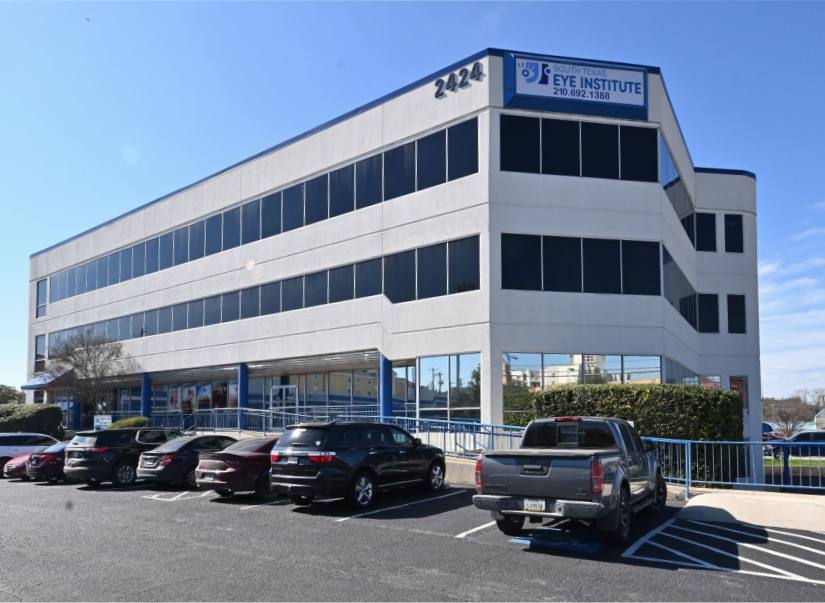
Retail Space
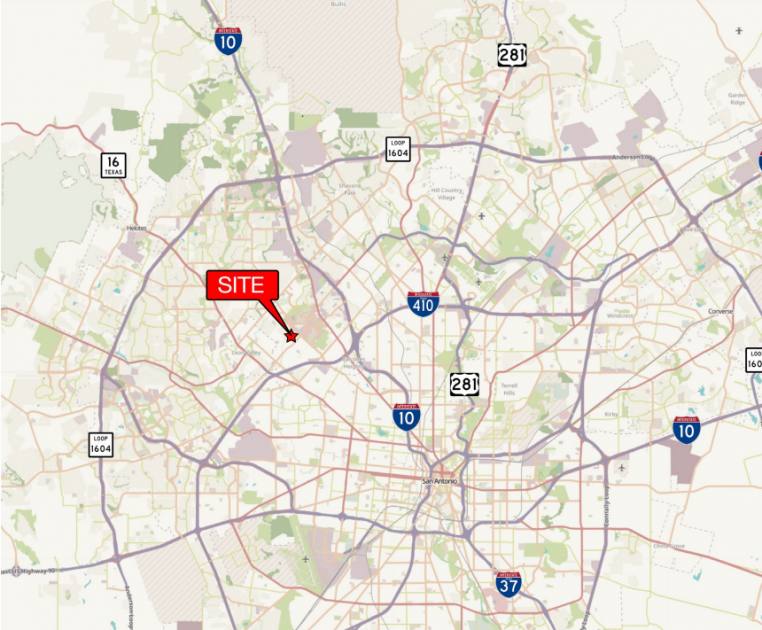
2414 Babcock Road San Antonio, TX 78229
2414 Babcock Road San Antonio, TX 78229
Details & Description
Property Highlights
- • 100% Leased
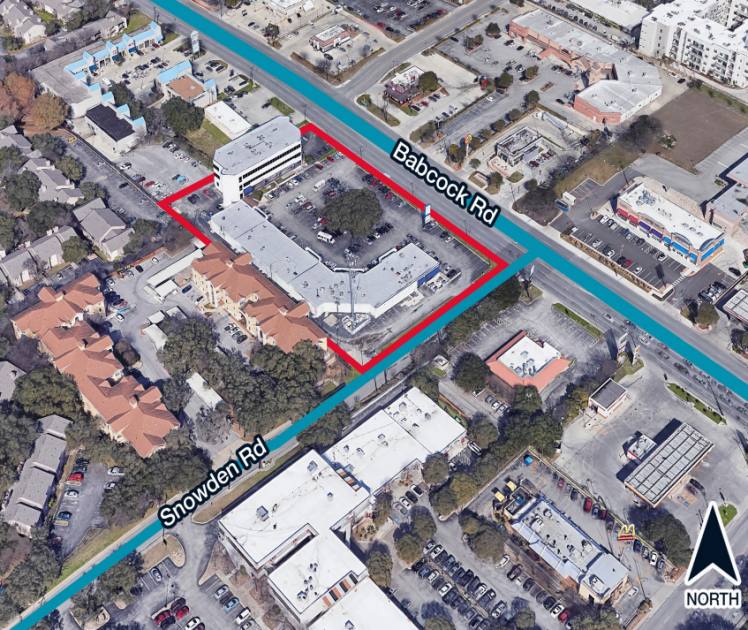
- • Excellent visibility
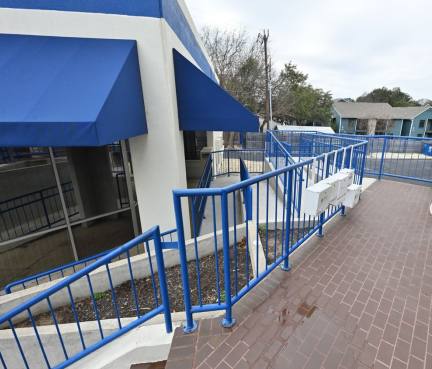
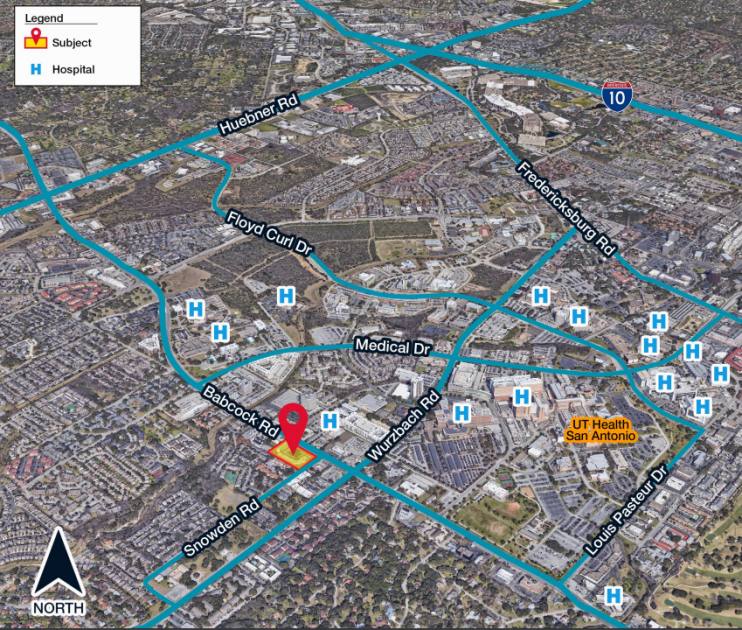
- • Easy ingress/egress to adjacent thoroughfares
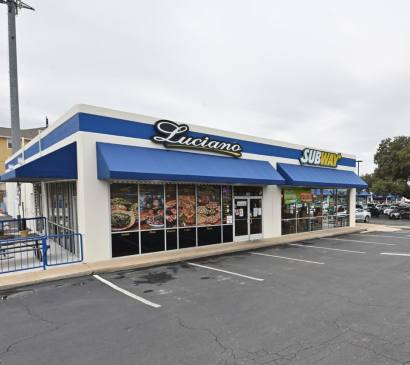
- • On-site restaurant
- • On-site management
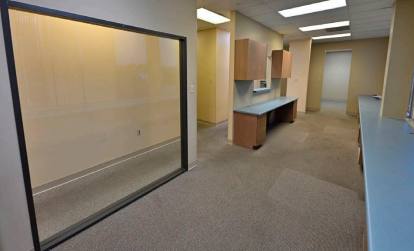
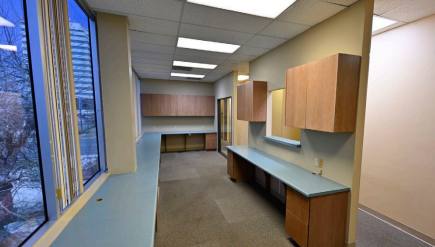
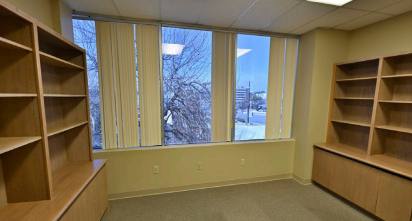
- • Common areas in clean condition
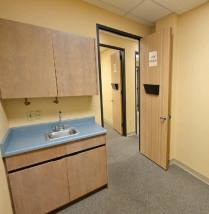
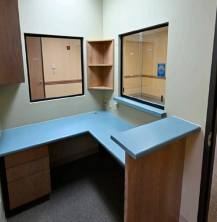
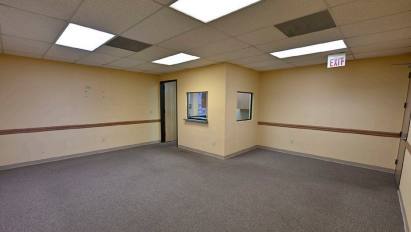
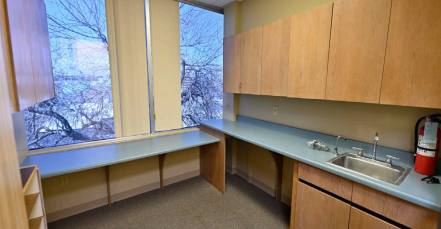
Additional Photos
Listing Agents

Michael Morse
O: 210-524-4000
M: 210-524-1312
mmorse@reocsanantonio.com
O: 210-524-4000
M: 210-524-1312
mmorse@reocsanantonio.com

Blake McFarlane Bonner
O: 210-524-4000
M: 210-524-1305
bbonner@reocsanantonio.com
O: 210-524-4000
M: 210-524-1305
bbonner@reocsanantonio.com
While we strive to provide the most accurate information, all listing information, and demographic data, is provided by third-parties. As such, MyEListing will not be responsible for the accuracy of the information. It is strongly recommended that you verify all information with the listing agent, and any relevant agencies, prior to making any decisions.