Flex-Office-Warehouse
1904 South Bagdad Road Leander, TX 78641
1904 South Bagdad Road Leander, TX 78641
Details & Description
Property Highlights
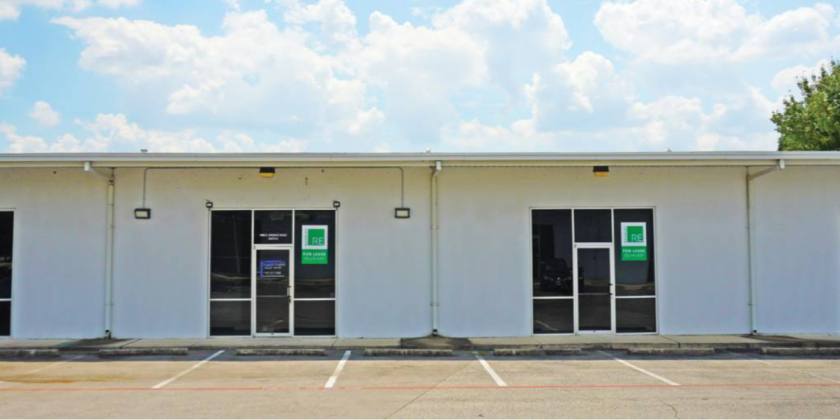
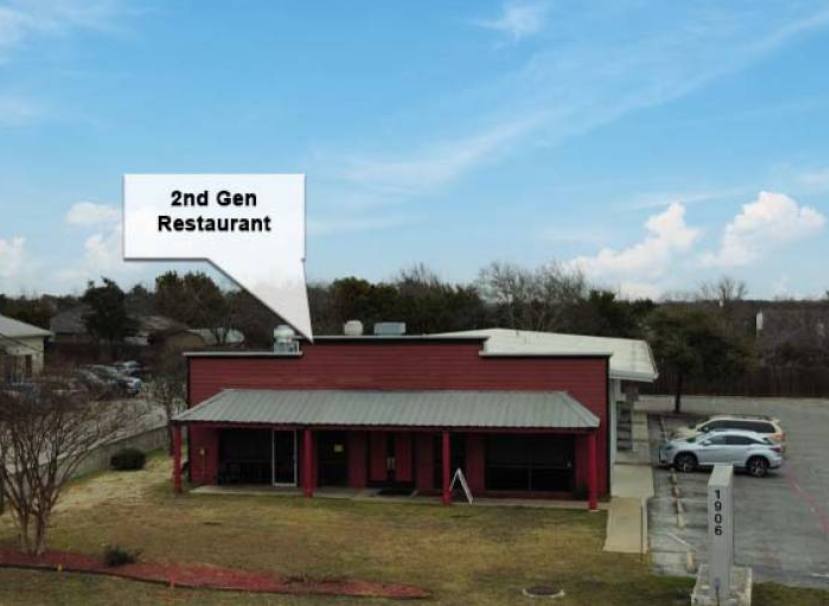
- • General Commercial Zoning
- • Ideal for Office, Retail, or Warehouse
- • Semi Dock
- • Tenant Improvement Allowance Available
Listing Agents

Austin Aguilar
O: 512-474-5557
M: 512-921-4388
aaguilar@resolutre.com
O: 512-474-5557
M: 512-921-4388
aaguilar@resolutre.com
While we strive to provide the most accurate information, all listing information, and demographic data, is provided by third-parties. As such, MyEListing will not be responsible for the accuracy of the information. It is strongly recommended that you verify all information with the listing agent, and any relevant agencies, prior to making any decisions.