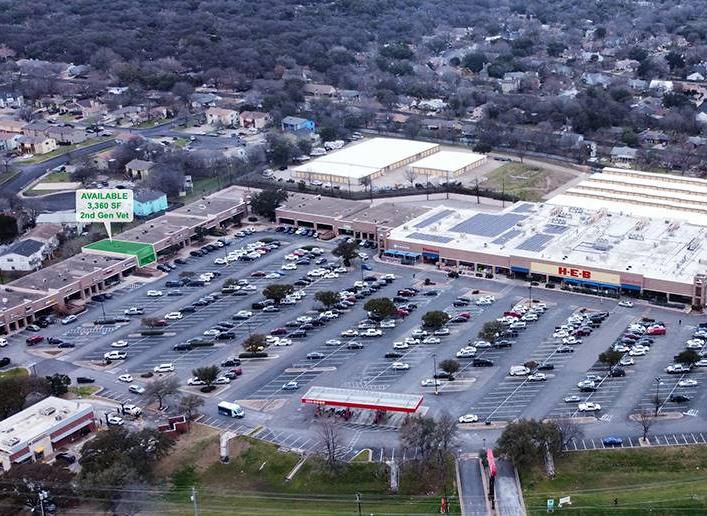
1-Mile | 3-Miles | 5-Miles | ||
---|---|---|---|---|
Total Population | 13,846 | 106,760 | 225,089 | |
Population Median Age | 36 | 38 | 37 | |
Population by Age | 0-9 Yrs | 1684 (12%) | 12853 (12%) | 27439 (12%) |
10-19 Yrs | 1295 (9%) | 8768 (8%) | 21219 (9%) | |
20-29 Yrs | 2266 (16%) | 16457 (15%) | 35626 (15%) | |
30-39 Yrs | 3118 (22%) | 22250 (20%) | 43574 (19%) | |
40-49 Yrs | 1721 (12%) | 15873 (14%) | 32655 (14%) | |
50-59 Yrs | 1874 (13%) | 12296 (11%) | 26985 (11%) | |
60-69 Yrs | 1152 (8%) | 11142 (10%) | 22586 (10%) | |
70+ Yrs | 734 (5%) | 7120 (6%) | 15004 (6%) | |
Median HH Income | $81,532 | $83,020 | $81,187 | |
Total Household Income | < 24K | 737 (13%) | 4518 (10%) | 10223 (11%) |
25-49K | 861 (15%) | 7483 (17%) | 16170 (17%) | |
50-74K | 1066 (18%) | 7816 (17%) | 16041 (17%) | |
75-99K | 624 (11%) | 6446 (14%) | 13237 (14%) | |
100-199K | 1846 (32%) | 13498 (30%) | 26864 (29%) | |
200K+ | 520 (9%) | 4010 (9%) | 8887 (9%) | |
Highest Education Level | No Diploma | 620 | 5219 | 14666 |
Diploma or GED | 1443 | 12212 | 25727 | |
Some College | 2292 | 17772 | 32484 | |
Assoc. Degree | 754 | 5399 | 10226 | |
Bachelors Degree | 3584 | 27307 | 53267 | |
Higher Degree | 1392 | 11837 | 27527 | |
Total Housing Units | 5,964 | 46,178 | 96,444 | |
--Owner-Occupied | 3,329 | 25,172 | 51,106 | |
--Renter-Occupied | 2,325 | 18,599 | 40,316 | |
Owner-Occupied Values | < 100K | 74 | 447 | 1852 |
100-199K | 231 | 2234 | 5280 | |
200-299K | 1272 | 9379 | 14583 | |
300-399K | 1263 | 9204 | 16473 | |
400-499K | 430 | 2836 | 8301 | |
500K+ | 58 | 1071 | 4617 | |
Total Working Age Population | 11,374 | 88,295 | 183,846 | |
In Work Force | 8,562 | 66,590 | 137,821 | |
Not In Work Force | 2,811 | 21,705 | 46,025 | |
Workforce Employed | 8,244 | 64,174 | 132,149 | |
Workforce Unemployed | 298 | 2,349 | 5,588 | |
Civlian Workforce | 8,543 | 66,523 | 137,737 | |
Military Workforce | 20 | 67 | 84 | |
Total Households | 5,654 | 43,771 | 91,422 | |
Family Households | 3,295 | 25,132 | 53,184 | |
Non-Family Households | 2,360 | 18,638 | 38,238 | |
Married Couple | 2,484 | 18,314 | 39,682 | |
Other Family | 810 | 6,819 | 13,502 | |
Married w/Child | 1,034 | 7,620 | 17,098 | |
Single Male w/Child | 106 | 904 | 1,683 | |
Single Female w/Child | 339 | 1,814 | 4,624 |
Population Change Last Two Decades - Plus Projection
2000 | % | 2010 | % | 2020 | % | 2030 | |
---|---|---|---|---|---|---|---|
Texas | 20,851,820 | +21 | 25,145,561 | +18 | 29,677,668 | +18 | 34,894,452 |
Travis County | 812,280 | +26 | 1,024,266 | +26 | 1,291,502 | +19 | 1,540,812 |
Hays County | 97,589 | +61 | 157,107 | +50 | 234,896 | +48 | 347,120 |
Total Working Age Population:
Total Households:
Total Working Age Population:
Total Households:
Total Working Age Population:
Total Households: