Office Space
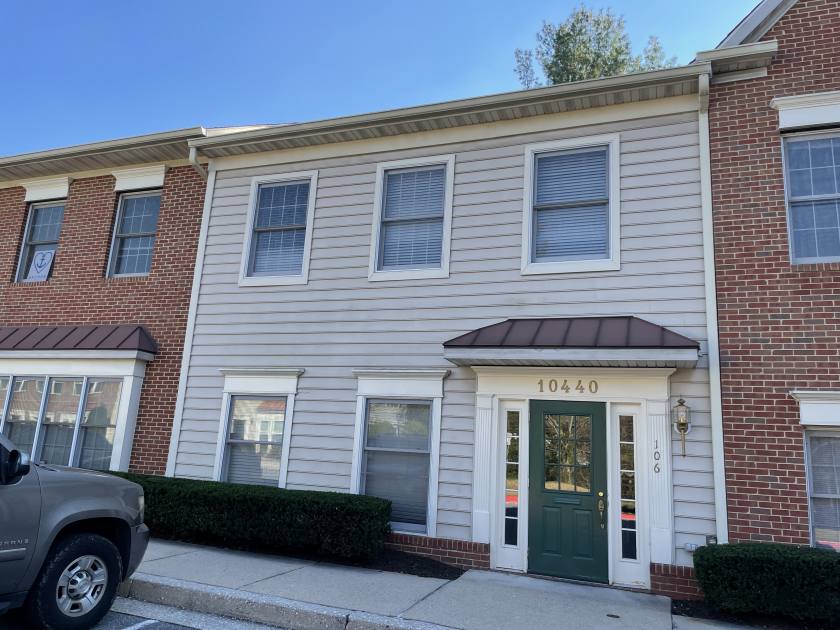
10440 Shaker Drive Columbia, MD 21046
10440 Shaker Drive Columbia, MD 21046

Details & Description
Property Highlights
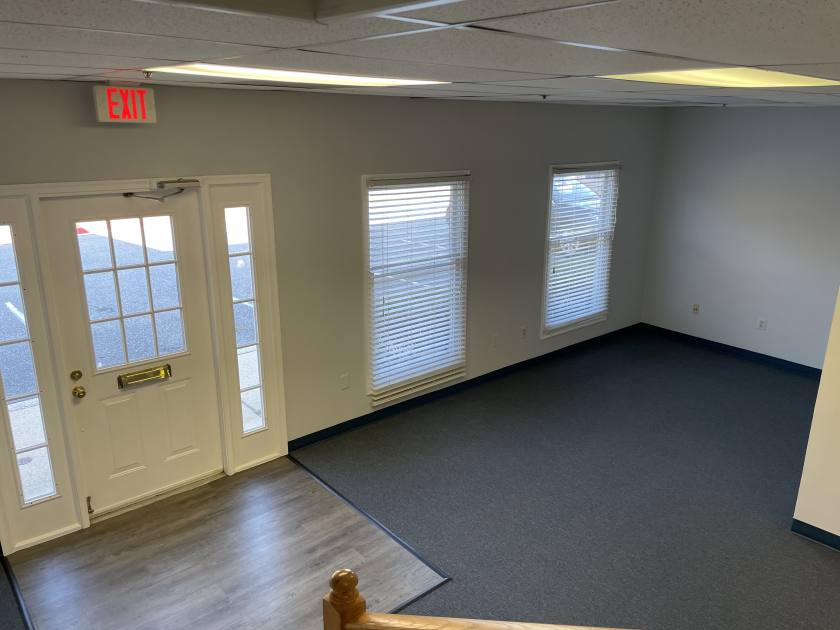
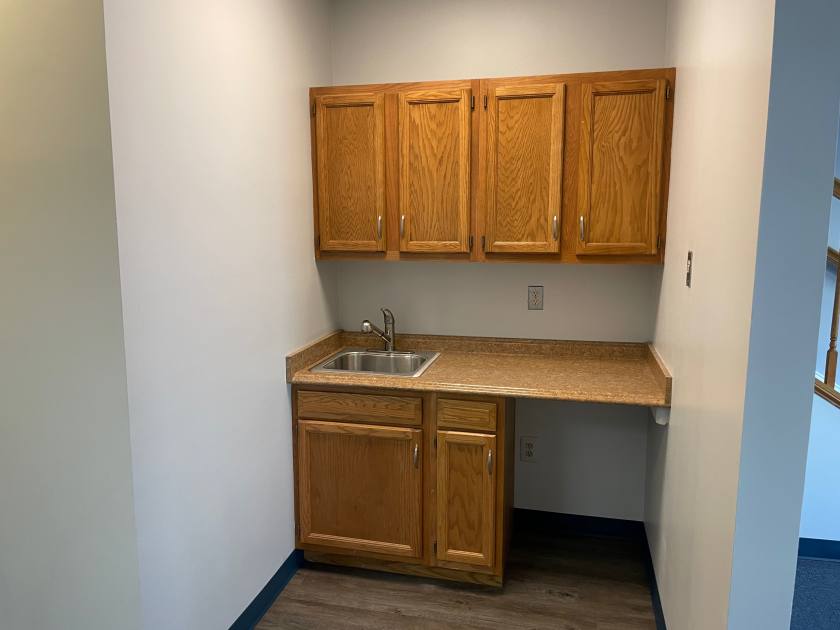
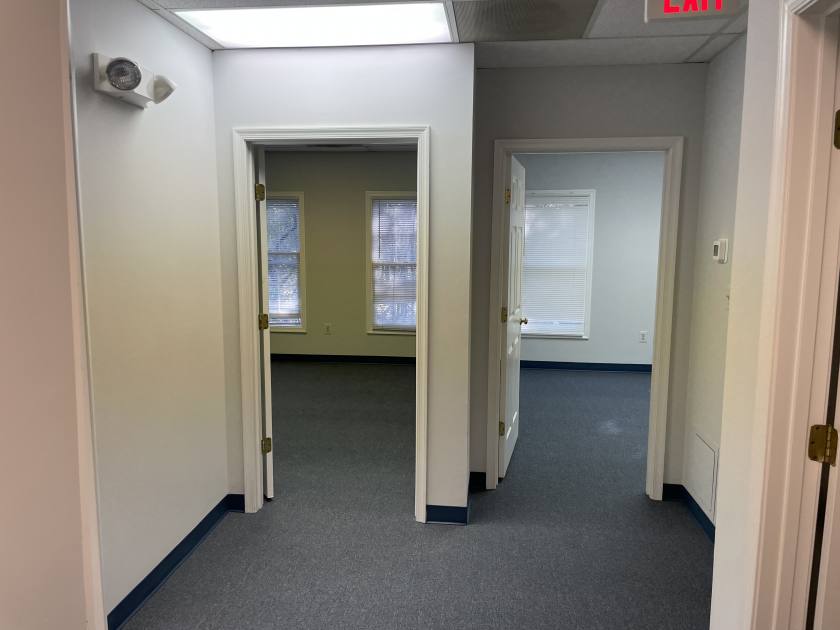
- • Fully built-out space on 1st and 2nd floor
- • The ideal situation for the small office user
- • Free and abundant parking
Additional Photos

Listing Agents

Bill Harrison
O: 443-741-4045
M: 410-299-2500
bharrison@lee-associates.com
O: 443-741-4045
M: 410-299-2500
bharrison@lee-associates.com
While we strive to provide the most accurate information, all listing information, and demographic data, is provided by third-parties. As such, MyEListing will not be responsible for the accuracy of the information. It is strongly recommended that you verify all information with the listing agent, and any relevant agencies, prior to making any decisions.