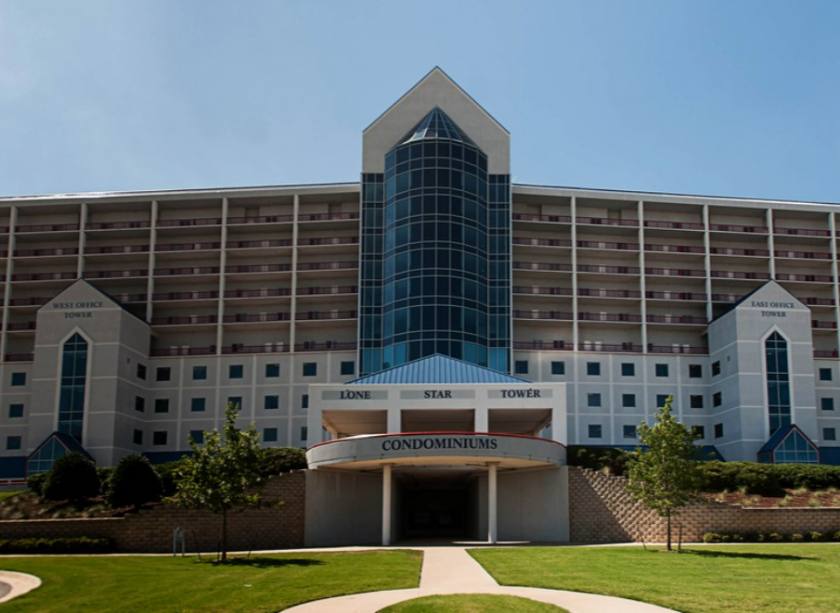
Office Space
3575 Lone Star Circle Fort Worth, TX 76177
3575 Lone Star Circle Fort Worth, TX 76177
Details & Description
Property Highlights
- • Cost of Electric: $2.25 PSF
- • Varied suite sizes available
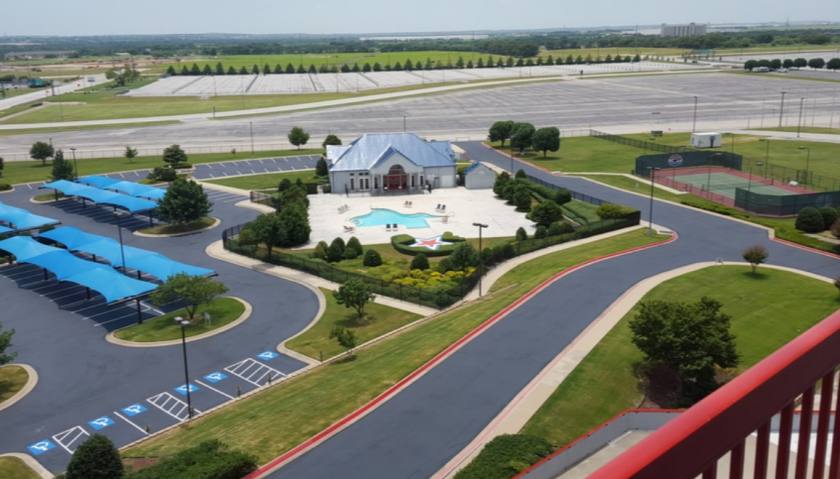
- • Management team on site
- • Gross Lease plus electric
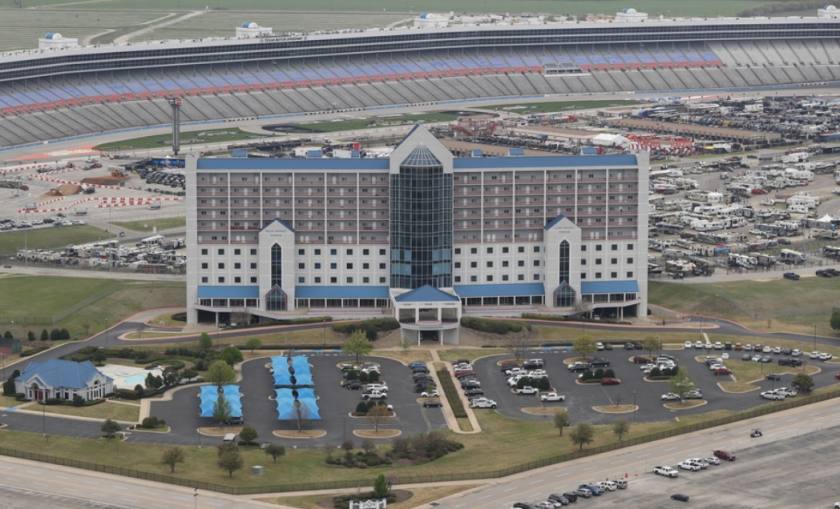
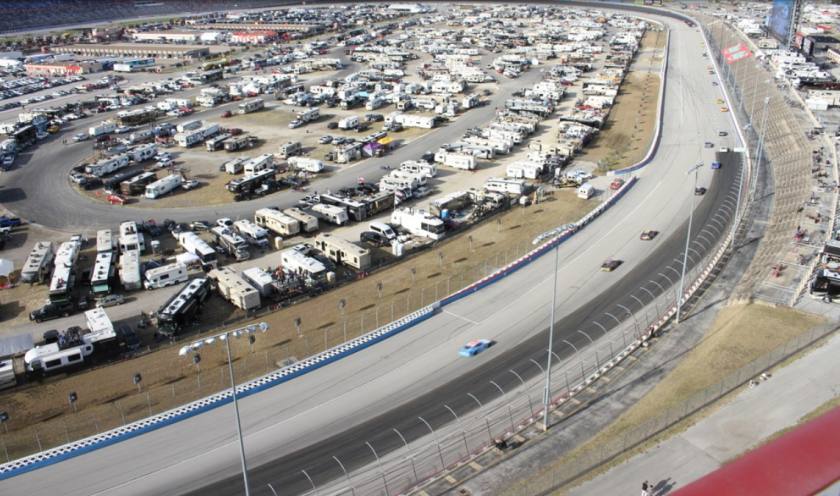
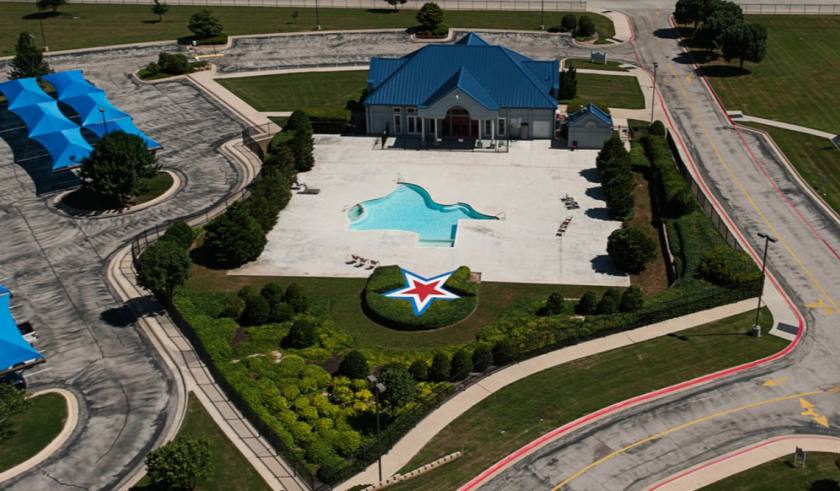
- • Unmatched views of the Texas Motor Speedway
- • Race tickets provided on a PSF basis
Additional Photos
Listing Agents

Brad Tyndall
O: 940-381-2220
M: 682-553-3766
btyndall@v-re.com
O: 940-381-2220
M: 682-553-3766
btyndall@v-re.com
While we strive to provide the most accurate information, all listing information, and demographic data, is provided by third-parties. As such, MyEListing will not be responsible for the accuracy of the information. It is strongly recommended that you verify all information with the listing agent, and any relevant agencies, prior to making any decisions.


