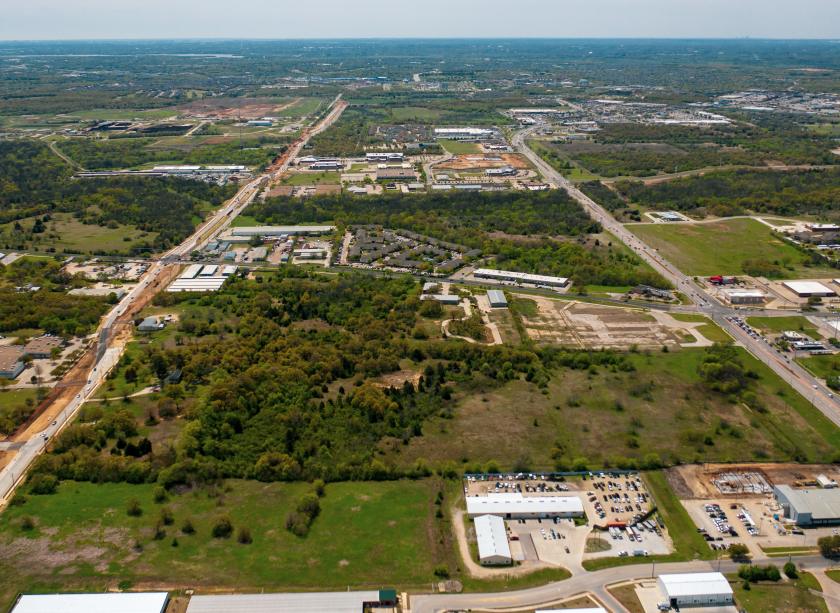
Commercial Land
100 North Loop 288 Denton, TX 76209
100 North Loop 288 Denton, TX 76209
Details & Description
Property Highlights
- • Lot Size Range 1.0 - 8.3 Acres
- • Frontage on 3 major thoroughfares
- • 2 signalized intersections
- • Full service median break on Loop 288
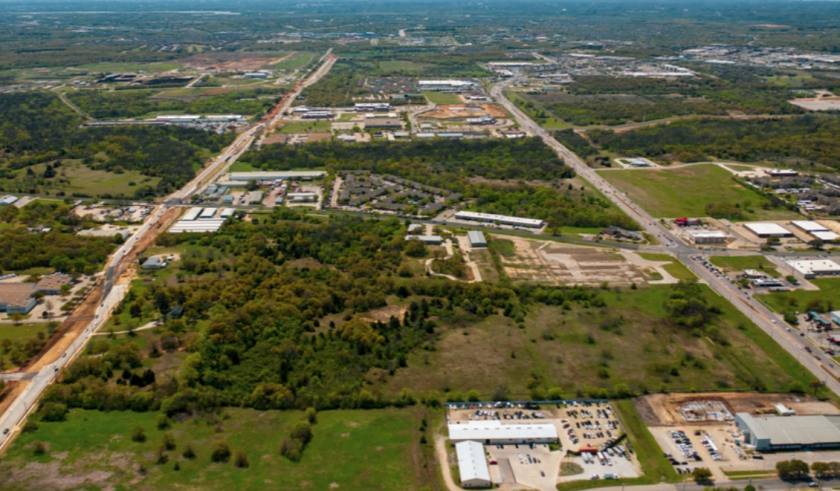
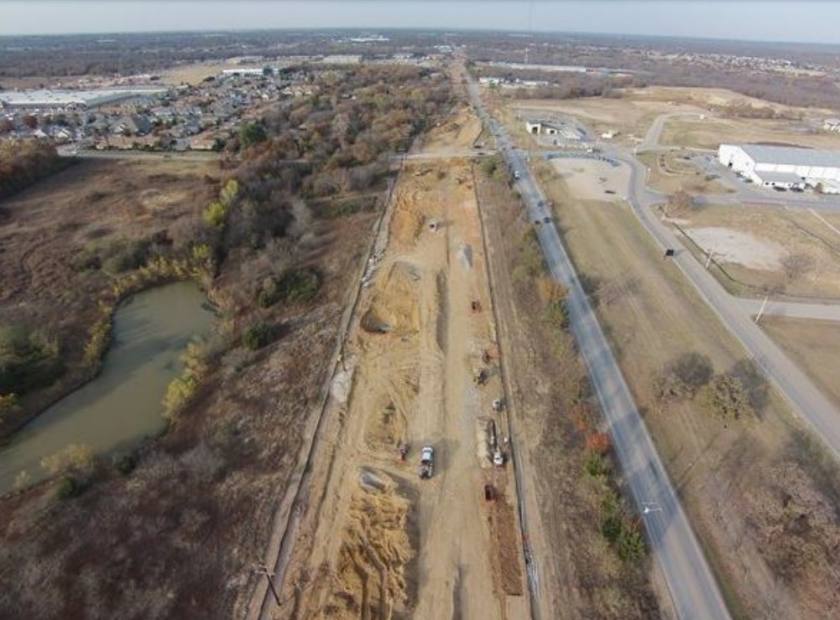
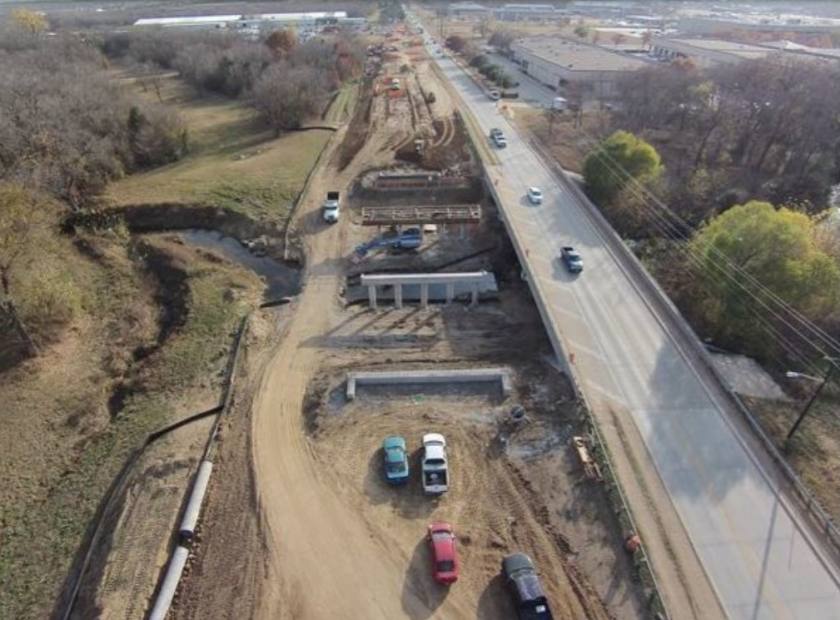
Additional Photos

Listing Agents

Greg Johnson
O: 940-381-2220
M: 940-594-7717
gjohnson@v-re.com
O: 940-381-2220
M: 940-594-7717
gjohnson@v-re.com

Nathan Tune
O: 940-381-2220
ntune@v-re.com
O: 940-381-2220
ntune@v-re.com

Brad Tyndall
O: 940-381-2220
M: 682-553-3766
btyndall@v-re.com
O: 940-381-2220
M: 682-553-3766
btyndall@v-re.com
While we strive to provide the most accurate information, all listing information, and demographic data, is provided by third-parties. As such, MyEListing will not be responsible for the accuracy of the information. It is strongly recommended that you verify all information with the listing agent, and any relevant agencies, prior to making any decisions.


