Office Space
6213 Skyline Drive Houston, TX 77057
6213 Skyline Drive Houston, TX 77057

Details & Description
Property Highlights
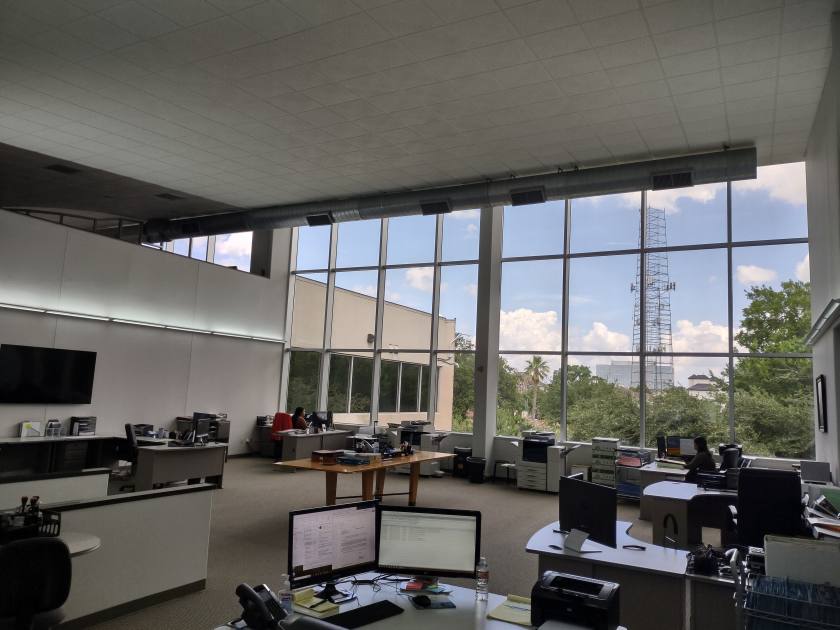
• 3 -Story Office Building can be designed for Single or Multi-Tenant Use Property is a beautiful Class A Office building
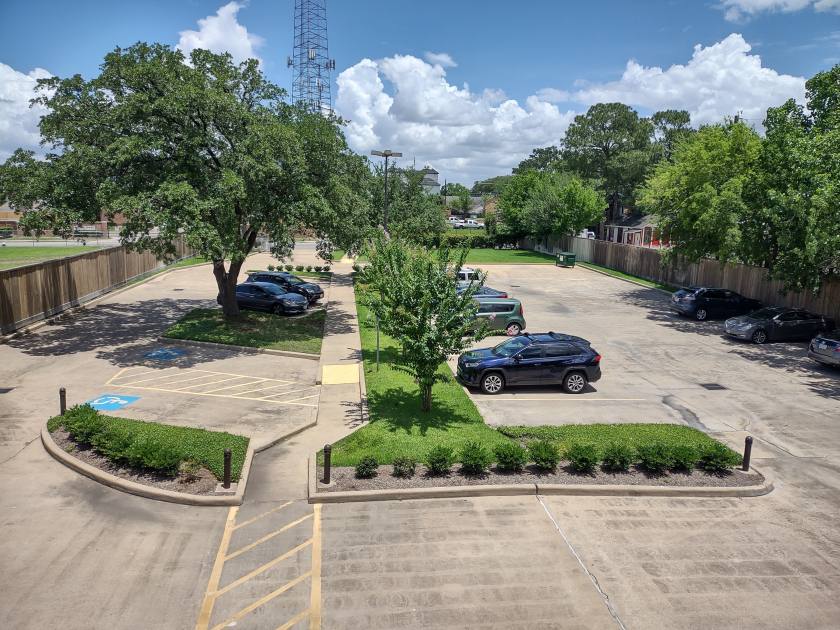
• Prime Location in near SWwest/West Houston submarket with easy access to the S.W. Freeway,610 Loop, Galleria & Down
Additional Photos


Listing Agents

Mike Atterberry
O: 281-558-4644
inh@inhrealtycorp.com
O: 281-558-4644
inh@inhrealtycorp.com
While we strive to provide the most accurate information, all listing information, and demographic data, is provided by third-parties. As such, MyEListing will not be responsible for the accuracy of the information. It is strongly recommended that you verify all information with the listing agent, and any relevant agencies, prior to making any decisions.