Commercial Land
US 42 West Jefferson, OH 43162
US 42 West Jefferson, OH 43162
Details & Description
Property Highlights
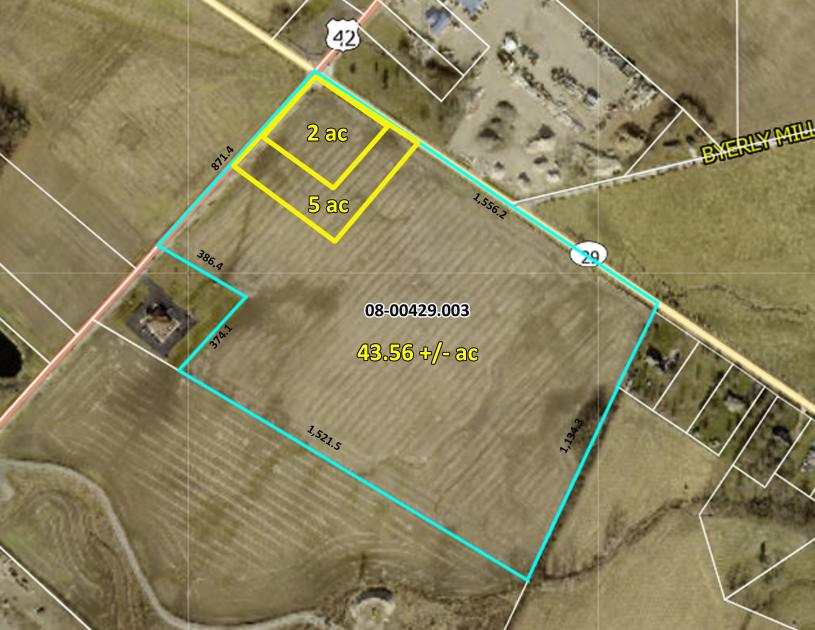
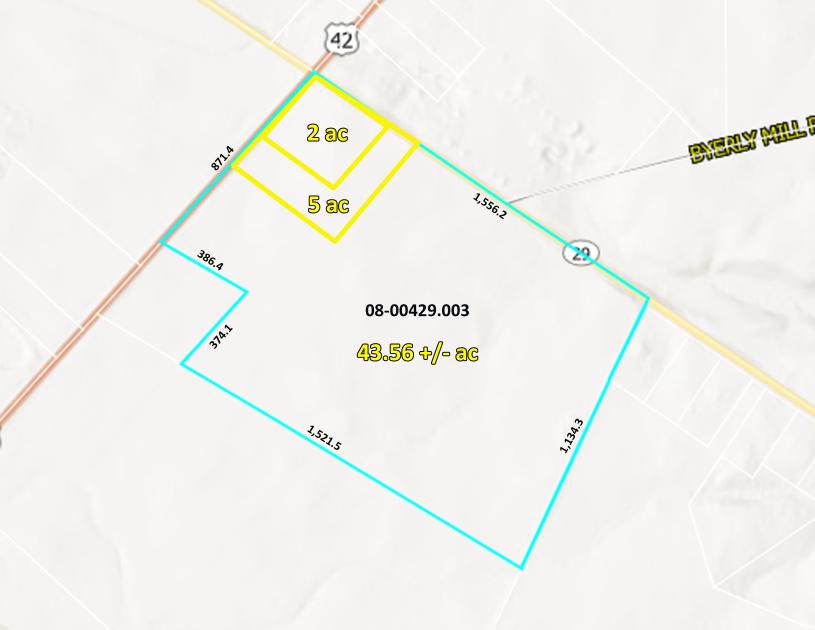
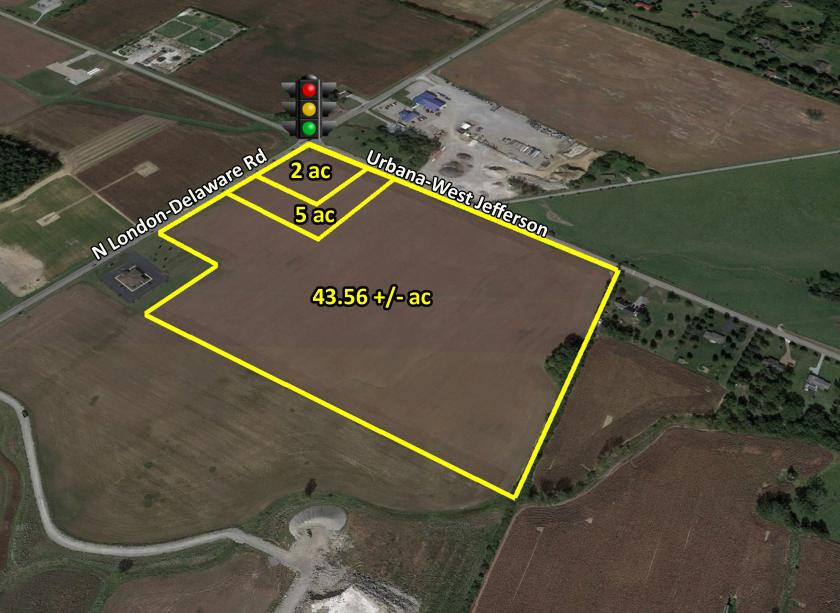
• Owner is willing to split the corner lot off the main parcel
• Great location at the southeast corner of US 42 & SR 29
Additional Photos


Listing Agents

Skip Weiler
O: 614-221-4286
skip@rweiler.com
O: 614-221-4286
skip@rweiler.com
While we strive to provide the most accurate information, all listing information, and demographic data, is provided by third-parties. As such, MyEListing will not be responsible for the accuracy of the information. It is strongly recommended that you verify all information with the listing agent, and any relevant agencies, prior to making any decisions.