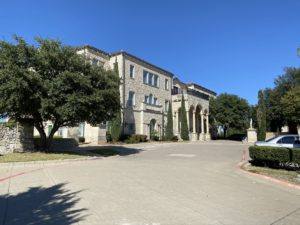
1-Mile | 3-Miles | 5-Miles | ||
---|---|---|---|---|
Total Population | 12,745 | 107,153 | 221,913 | |
Population Median Age | 35 | 35 | 35 | |
Population by Age | 0-9 Yrs | 2402 (18%) | 17005 (15%) | 35071 (15%) |
10-19 Yrs | 2097 (16%) | 18192 (16%) | 36764 (16%) | |
20-29 Yrs | 571 (4%) | 8698 (8%) | 19348 (8%) | |
30-39 Yrs | 1409 (11%) | 15034 (14%) | 33491 (15%) | |
40-49 Yrs | 2723 (21%) | 20704 (19%) | 40671 (18%) | |
50-59 Yrs | 1811 (14%) | 13253 (12%) | 26126 (11%) | |
60-69 Yrs | 861 (6%) | 7550 (7%) | 15772 (7%) | |
70+ Yrs | 872 (6%) | 6717 (6%) | 14669 (6%) | |
Median HH Income | $129,556 | $122,555 | $115,965 | |
Total Household Income | < 24K | 374 (8%) | 2157 (6%) | 5193 (7%) |
25-49K | 508 (11%) | 3428 (9%) | 8166 (11%) | |
50-74K | 266 (6%) | 3713 (10%) | 8562 (11%) | |
75-99K | 480 (11%) | 4141 (11%) | 9310 (12%) | |
100-199K | 1656 (38%) | 14981 (42%) | 28023 (38%) | |
200K+ | 1043 (24%) | 6668 (19%) | 14258 (19%) | |
Highest Education Level | No Diploma | 207 | 1866 | 6260 |
Diploma or GED | 743 | 8121 | 18149 | |
Some College | 1252 | 12169 | 25350 | |
Assoc. Degree | 508 | 6203 | 12291 | |
Bachelors Degree | 3400 | 25898 | 50405 | |
Higher Degree | 1811 | 13003 | 27614 | |
Total Housing Units | 4,469 | 36,165 | 77,453 | |
--Owner-Occupied | 3,193 | 26,626 | 52,101 | |
--Renter-Occupied | 1,134 | 8,461 | 21,412 | |
Owner-Occupied Values | < 100K | 51 | 446 | 856 |
100-199K | 50 | 769 | 2383 | |
200-299K | 356 | 7288 | 12996 | |
300-399K | 927 | 10043 | 16430 | |
400-499K | 777 | 4693 | 10449 | |
500K+ | 1031 | 3387 | 8986 | |
Total Working Age Population | 8,877 | 77,522 | 161,489 | |
In Work Force | 6,069 | 56,576 | 116,110 | |
Not In Work Force | 2,807 | 20,945 | 45,379 | |
Workforce Employed | 5,779 | 54,511 | 112,090 | |
Workforce Unemployed | 291 | 2,036 | 3,960 | |
Civlian Workforce | 6,069 | 56,546 | 116,050 | |
Military Workforce | 0 | 30 | 61 | |
Total Households | 4,327 | 35,087 | 73,512 | |
Family Households | 3,469 | 28,996 | 59,585 | |
Non-Family Households | 858 | 6,091 | 13,928 | |
Married Couple | 3,130 | 24,656 | 50,045 | |
Other Family | 339 | 4,340 | 9,540 | |
Married w/Child | 1,803 | 13,763 | 28,437 | |
Single Male w/Child | 62 | 905 | 1,674 | |
Single Female w/Child | 182 | 1,948 | 4,359 |
Population Change Last Two Decades - Plus Projection
2000 | % | 2010 | % | 2020 | % | 2030 | |
---|---|---|---|---|---|---|---|
Texas | 20,851,820 | +21 | 25,145,561 | +18 | 29,677,668 | +18 | 34,894,452 |
Collin County | 491,675 | +59 | 782,341 | +33 | 1,039,369 | +34 | 1,391,461 |
Total Working Age Population:
Total Households:
Total Working Age Population:
Total Households:
Total Working Age Population:
Total Households: