Industrial Properties
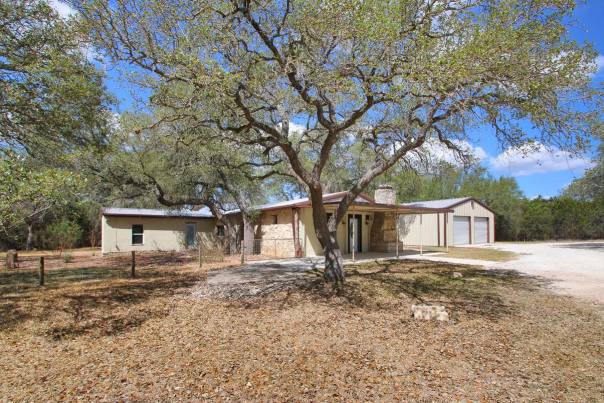
33401 Blanco Road Bulverde, TX 78163
33401 Blanco Road Bulverde, TX 78163

Details & Description
Property Highlights
- • For Sale or Lease
- • Sale Price: $1,400,000
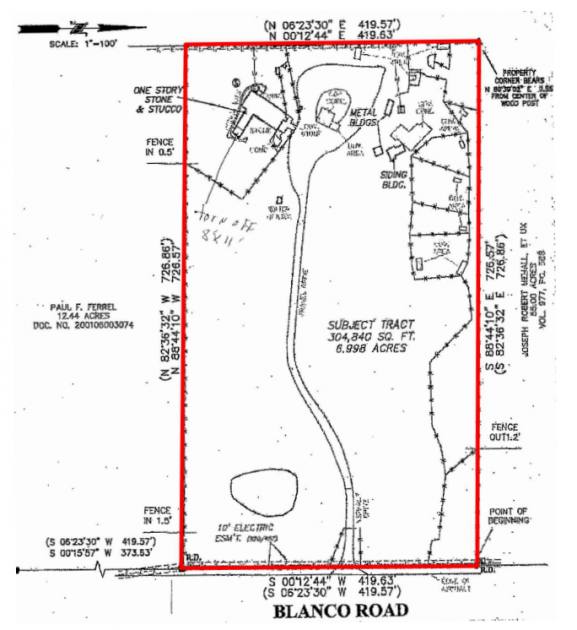
- • Land Size: ±6.998 Acres
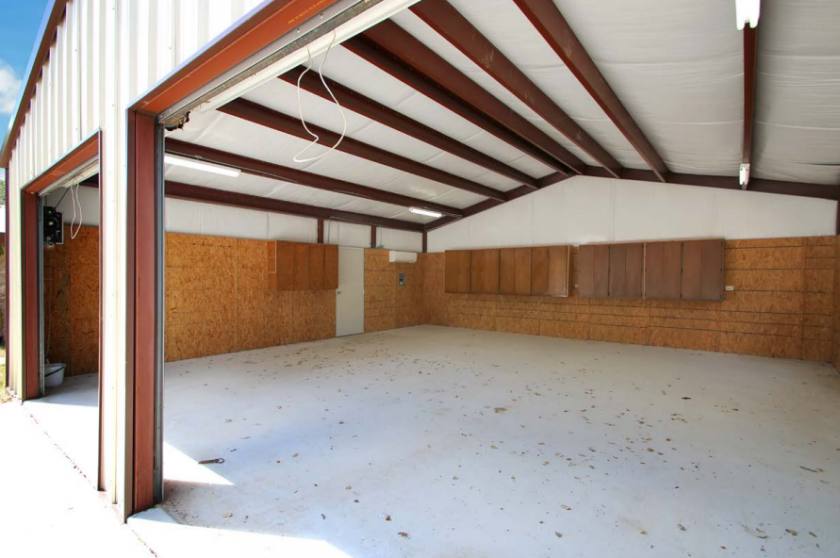
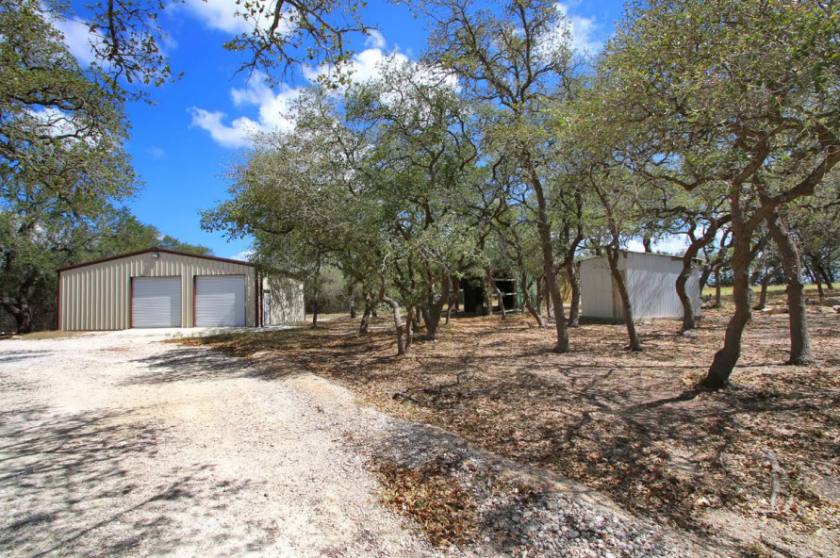
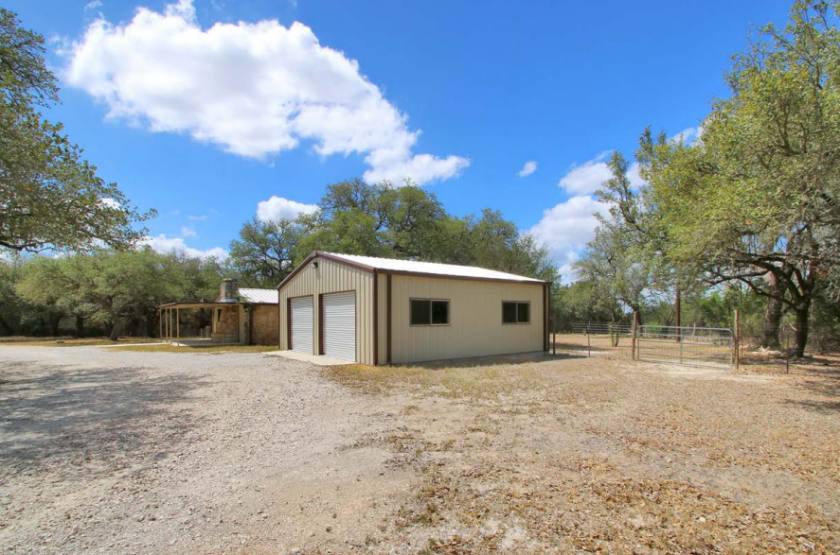
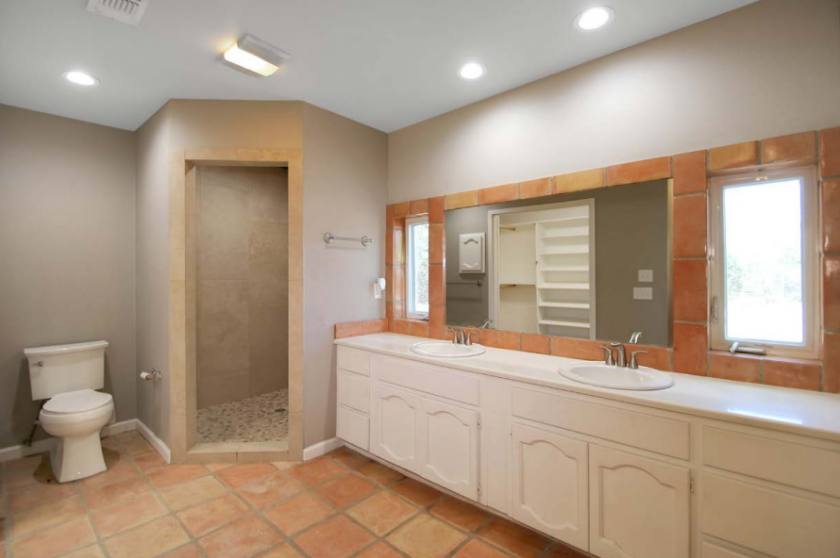
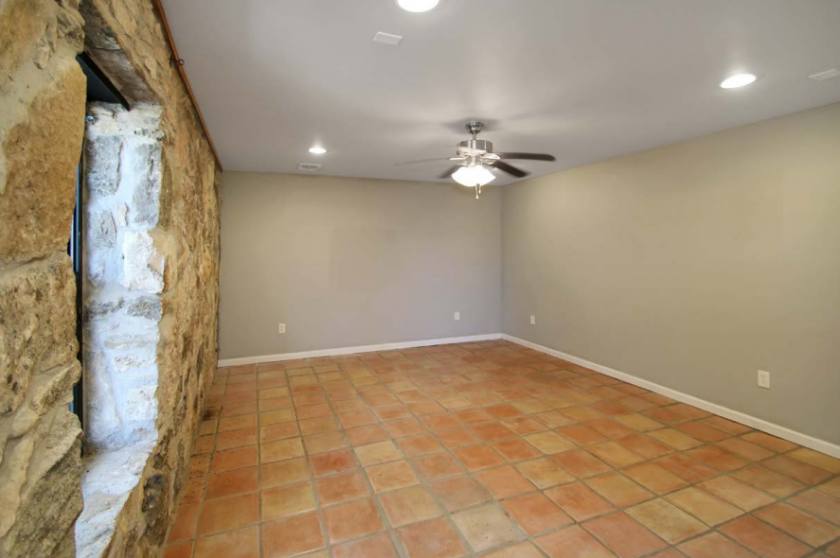
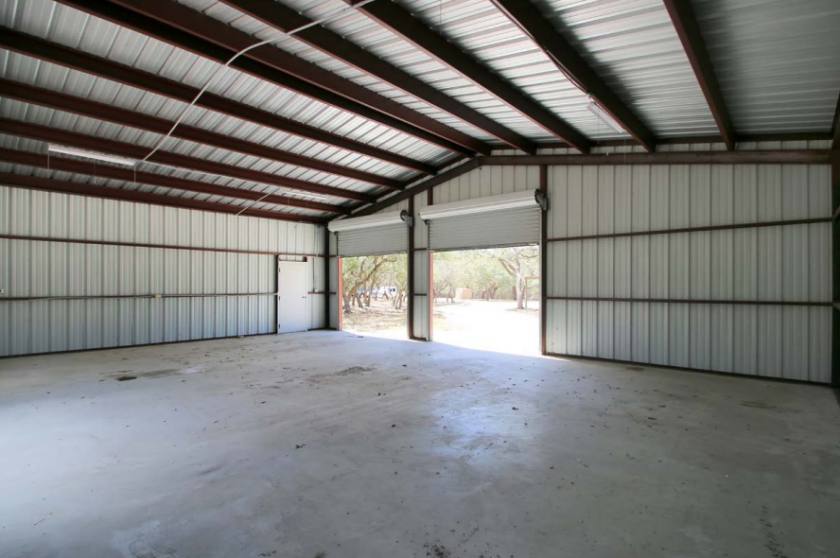
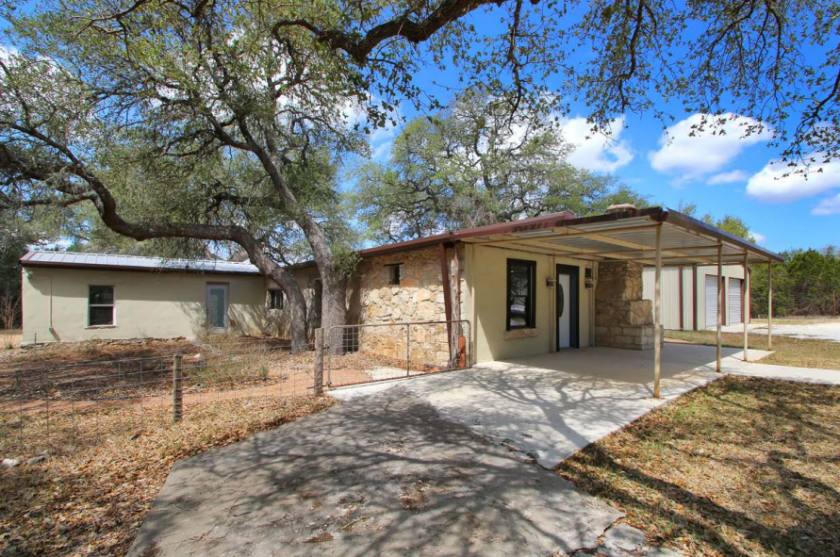
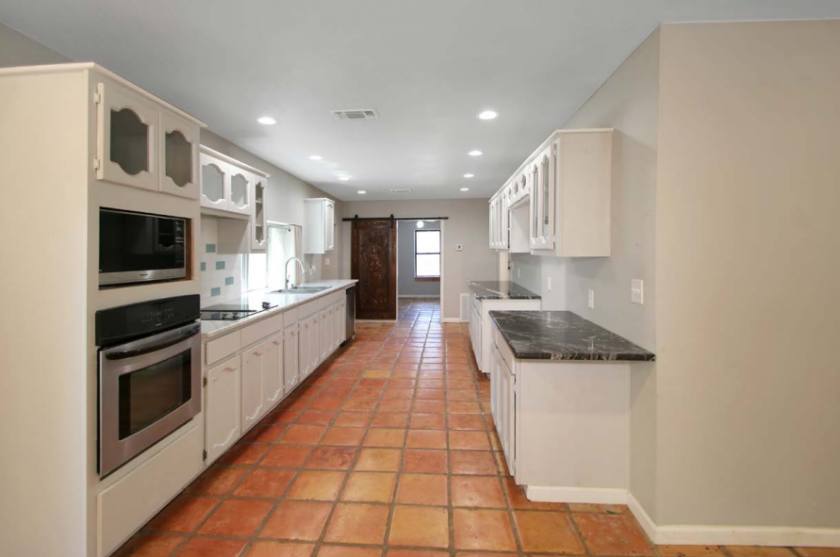
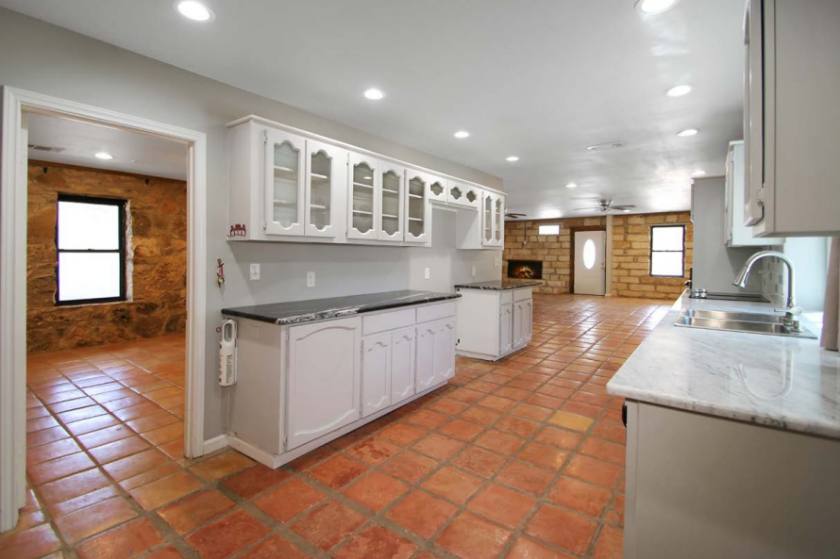
Additional Photos

Listing Agents

Alan Bass
M: 210-849-9665
alan@abassproperties.com
M: 210-849-9665
alan@abassproperties.com
While we strive to provide the most accurate information, all listing information, and demographic data, is provided by third-parties. As such, MyEListing will not be responsible for the accuracy of the information. It is strongly recommended that you verify all information with the listing agent, and any relevant agencies, prior to making any decisions.