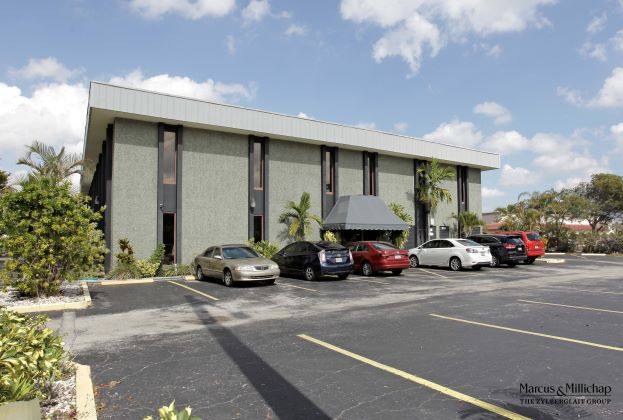
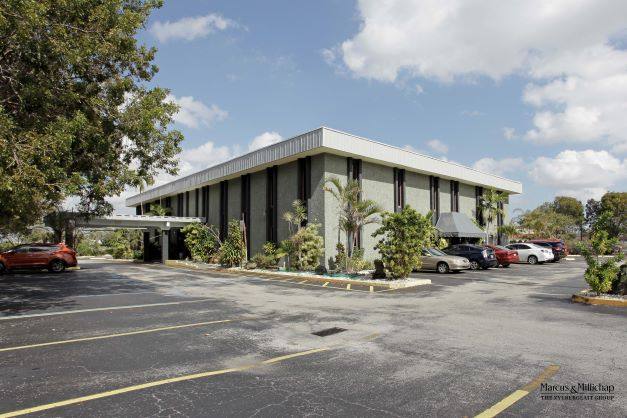
Office Space
6635 West Commercial Boulevard Tamarac, FL 33319
6635 West Commercial Boulevard Tamarac, FL 33319
Details & Description
Property Highlights
- • Short Term Leases with Significant Upside
- • Little to No Deferred Maintenance
- • Below Market Leasing Rates
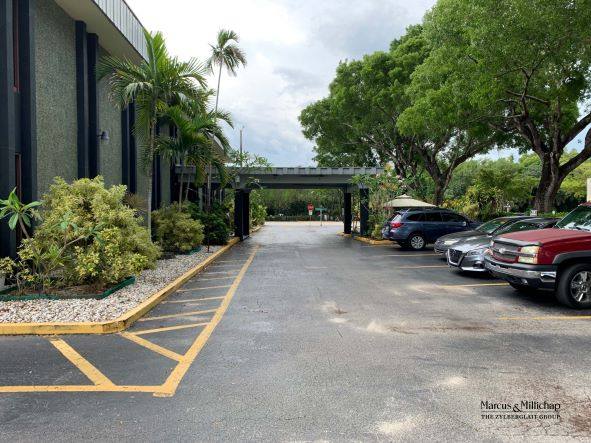
- • High Parking Ratio - 5.7:1000
- • 10 Year Warranty on Roof
- • FOB System for Overnight Entry-24 hr access
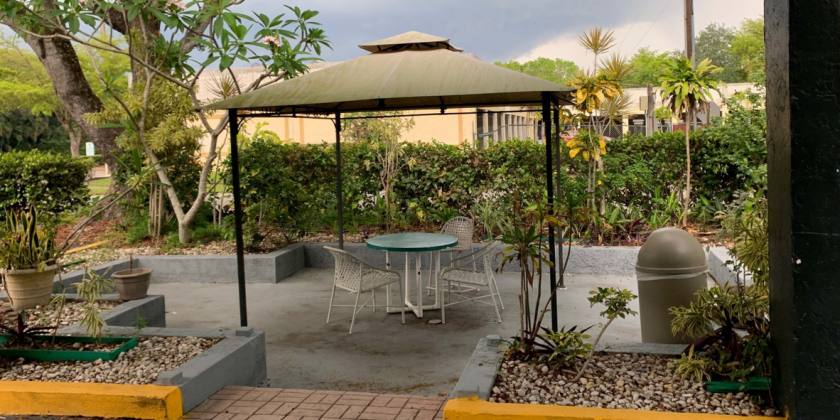
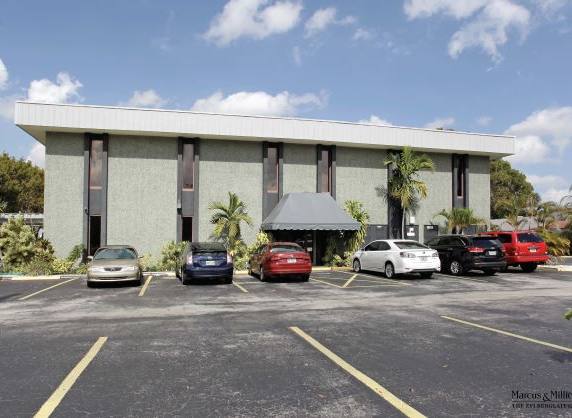
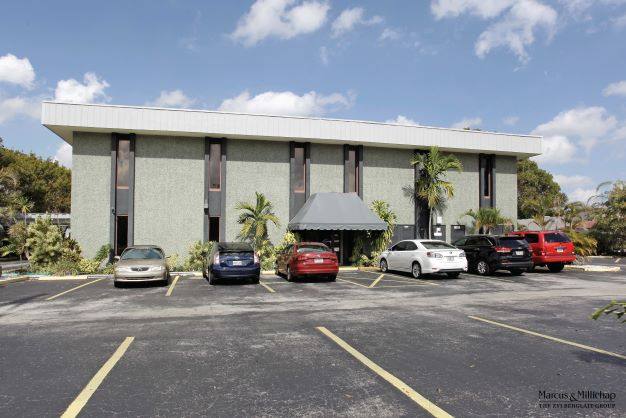
Additional Photos

Listing Agents

Michael Crocchiola
O: 786-522-7000
michael.crocchiola@marcusmillichap.com
O: 786-522-7000
michael.crocchiola@marcusmillichap.com
While we strive to provide the most accurate information, all listing information, and demographic data, is provided by third-parties. As such, MyEListing will not be responsible for the accuracy of the information. It is strongly recommended that you verify all information with the listing agent, and any relevant agencies, prior to making any decisions.