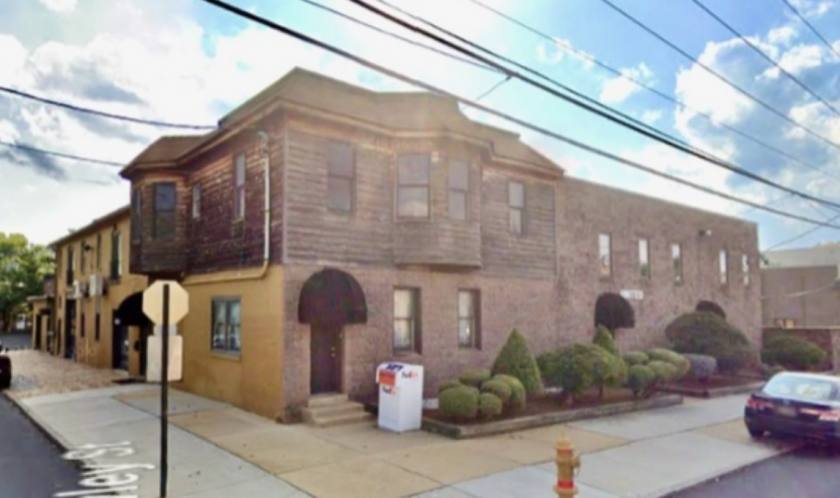
Office Space
2510 West 6th Street Wilmington, DE 19805
2510 West 6th Street Wilmington, DE 19805
Details & Description
Property Highlights
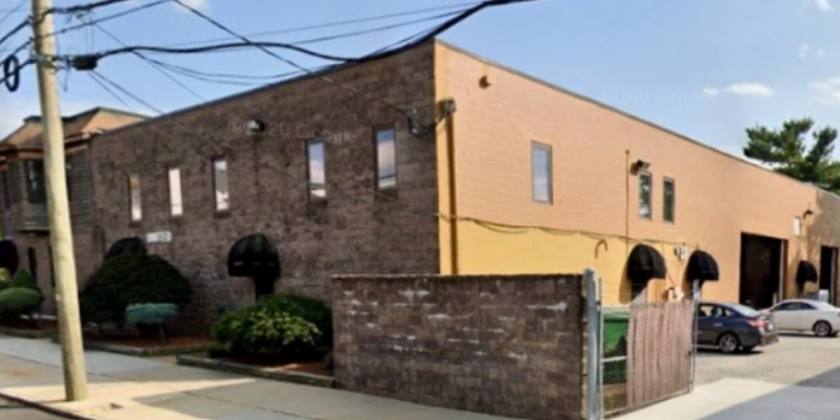
- • Two drive-in overhead doors
- • Some parking available
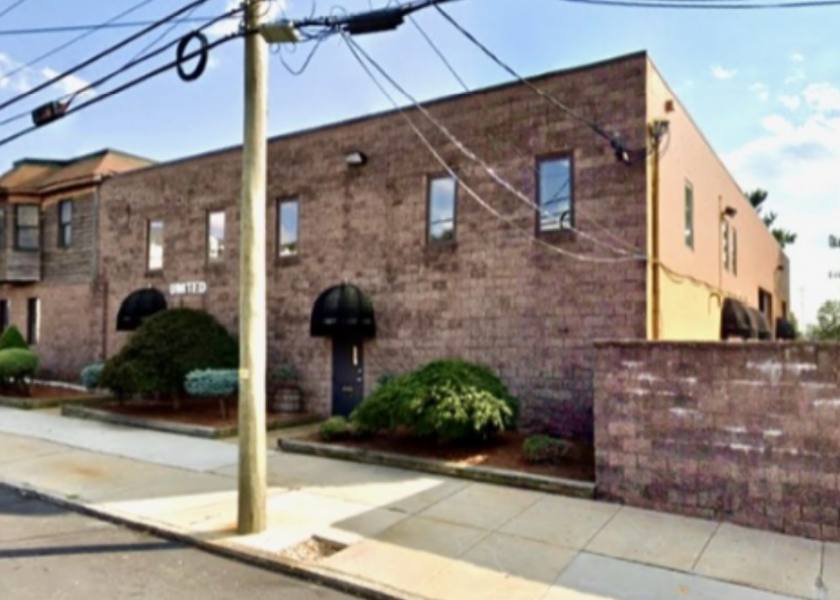
- • Desirable westside location
Listing Agents

Joe Latina
M: 302-350-1233
jlatina@lmtcre.com
M: 302-350-1233
jlatina@lmtcre.com

Tyler Foresta
M: 302-584-8615
tforesta@lmtcre.com
M: 302-584-8615
tforesta@lmtcre.com
While we strive to provide the most accurate information, all listing information, and demographic data, is provided by third-parties. As such, MyEListing will not be responsible for the accuracy of the information. It is strongly recommended that you verify all information with the listing agent, and any relevant agencies, prior to making any decisions.