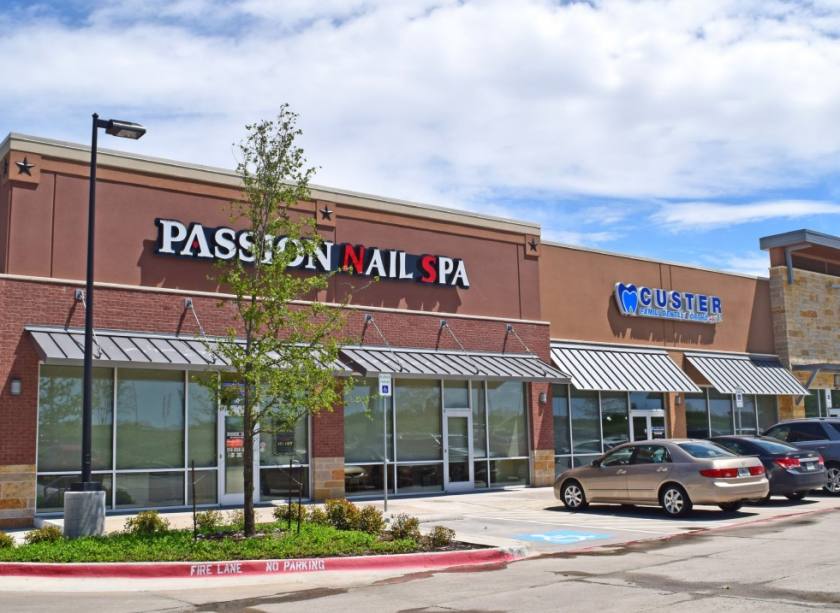
Retail Space
5131 South Custer Road Frisco, TX 75035
5131 South Custer Road Frisco, TX 75035
Details & Description
Property Highlights
- • 100% Leased
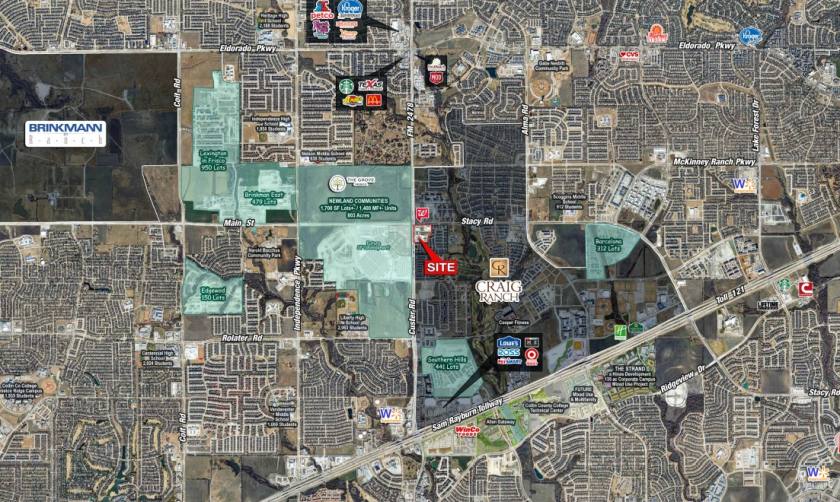
- • Traffic Counts: Custer: 49,721 VPD
- • Traffic Counts: Stacy Rd: 33,623 VPD
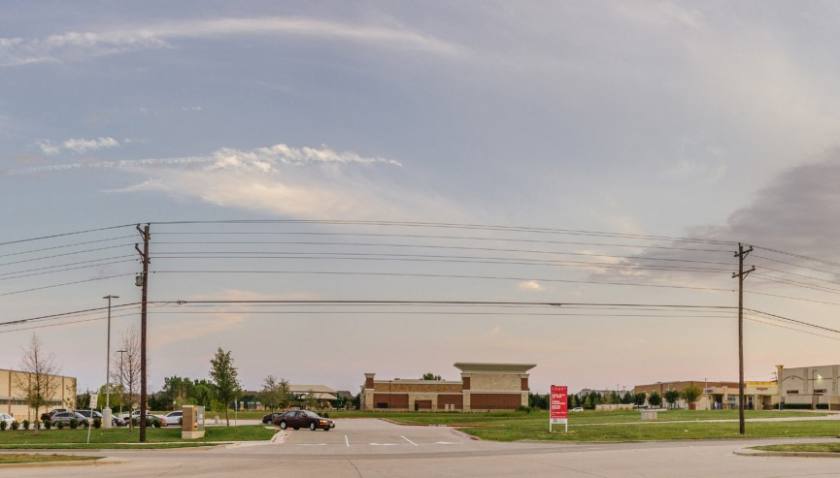
Additional Photos

Listing Agents

Thomas Glendenning
O: 214-960-4528
M: 214-960-4545
thomas@shopcompanies.com
O: 214-960-4528
M: 214-960-4545
thomas@shopcompanies.com

Landry Kemp
SHOP Co
O: 214-960-4545
M: 214-398-2546
landry@shopcompanies.com
SHOP Co
O: 214-960-4545
M: 214-398-2546
landry@shopcompanies.com
While we strive to provide the most accurate information, all listing information, and demographic data, is provided by third-parties. As such, MyEListing will not be responsible for the accuracy of the information. It is strongly recommended that you verify all information with the listing agent, and any relevant agencies, prior to making any decisions.


