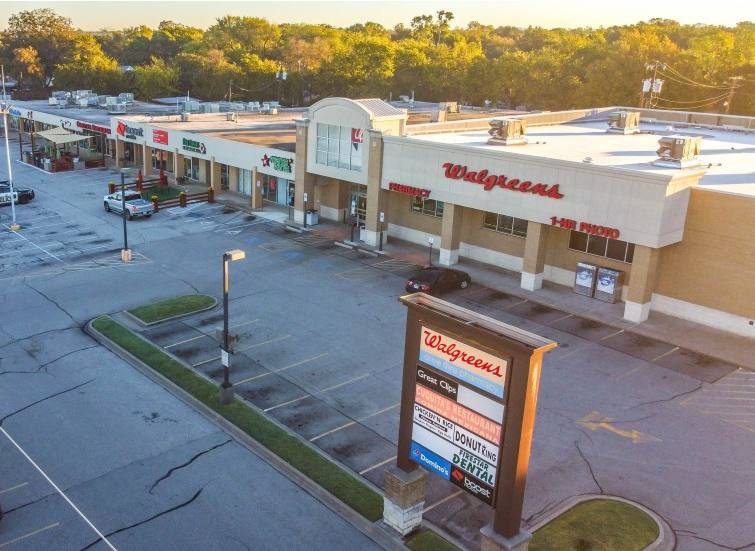
Retail Space
13260 Josey Lane Farmers Branch, TX 75234
13260 Josey Lane Farmers Branch, TX 75234
Details & Description
Property Highlights
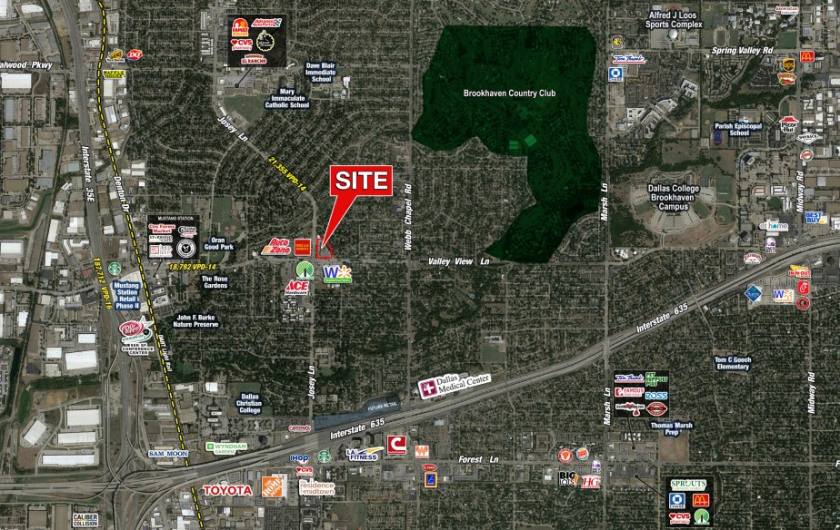
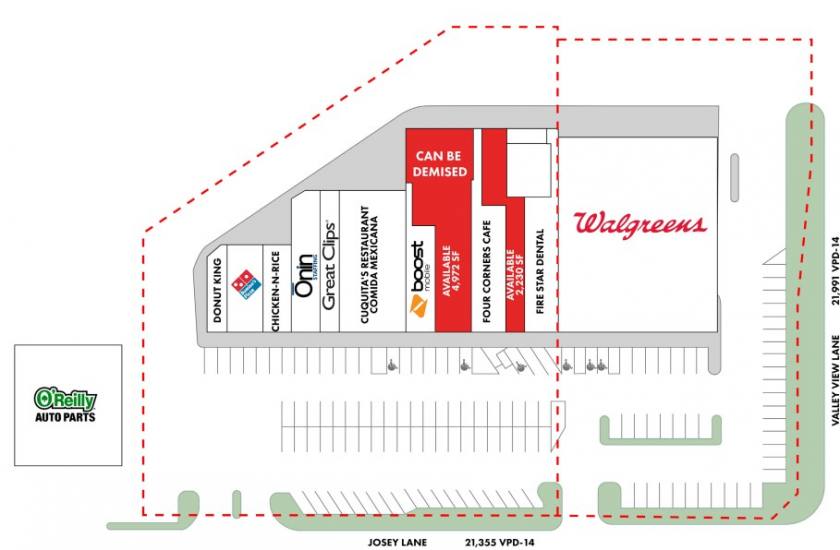
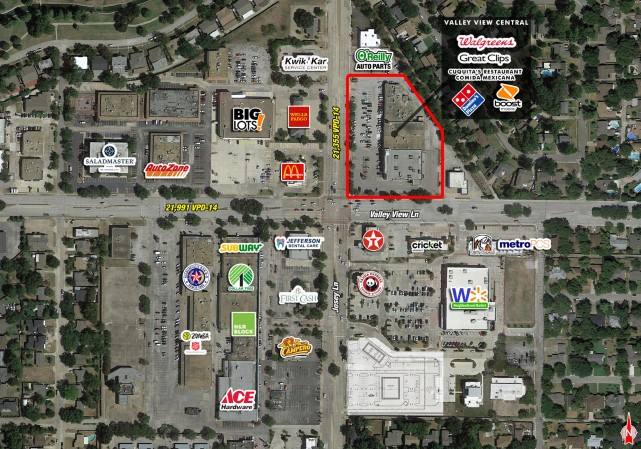
• Traffic Counts: Valley View Lane: 21,991 VPD-14
• Traffic Counts: Josey Lane: 21,355 VPD-14
Additional Photos
Listing Agents

Thomas Glendenning
O: 214-960-4528
M: 214-960-4545
thomas@shopcompanies.com
O: 214-960-4528
M: 214-960-4545
thomas@shopcompanies.com

Jake Sherrington
O: 214-960-4545
M: 214-960-4623
jake@shopcompanies.com
O: 214-960-4545
M: 214-960-4623
jake@shopcompanies.com
While we strive to provide the most accurate information, all listing information, and demographic data, is provided by third-parties. As such, MyEListing will not be responsible for the accuracy of the information. It is strongly recommended that you verify all information with the listing agent, and any relevant agencies, prior to making any decisions.


