Retail Space
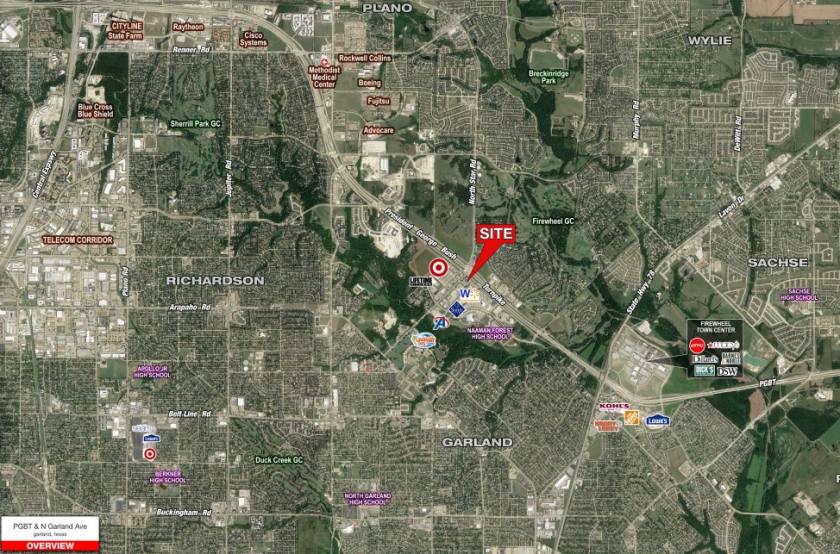
5345 North President George Bush Highway Garland, TX 75040
5345 North President George Bush Highway Garland, TX 75040
Details & Description
Property Highlights
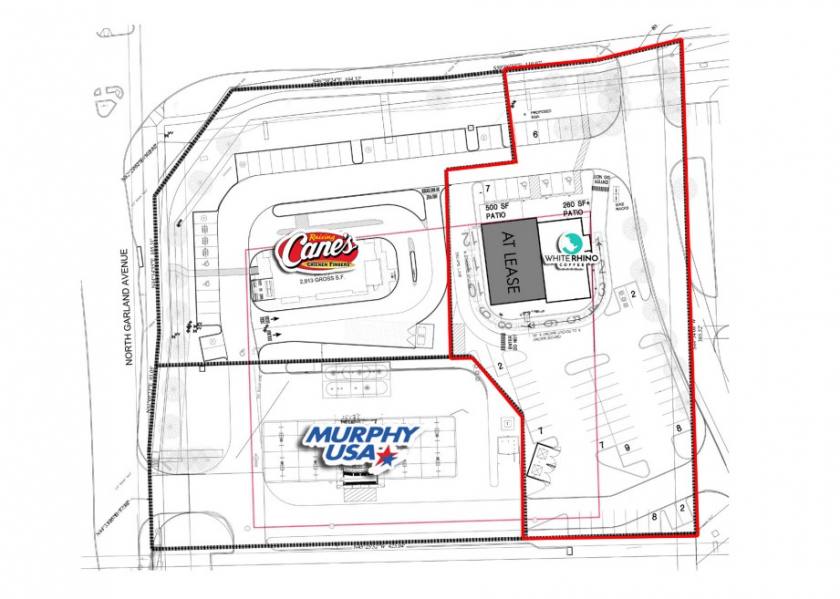
- • 2,200 SF with a drive-thru Available for lease
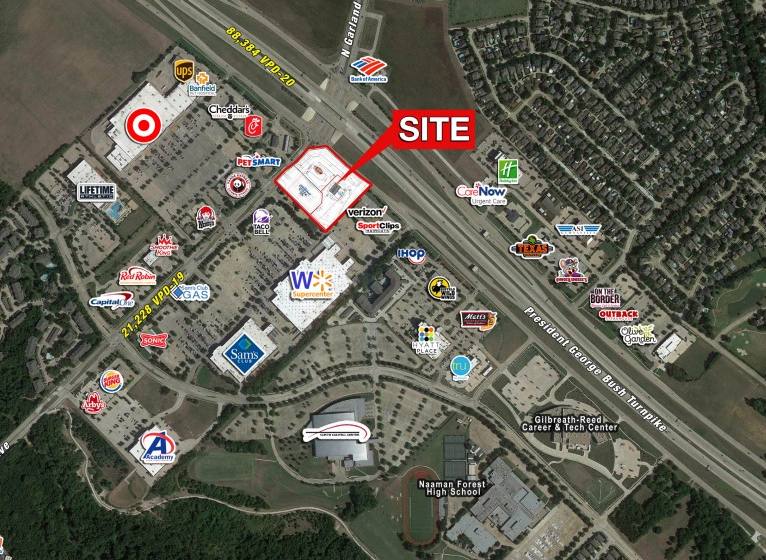
- • Traffic Counts: SH 190: 111,753 VPD
- • Traffic Counts: N Garland Ave: 23,808 VPD
Listing Agents

Thomas Glendenning
O: 214-960-4528
M: 214-960-4545
thomas@shopcompanies.com
O: 214-960-4528
M: 214-960-4545
thomas@shopcompanies.com

Jake Sherrington
O: 214-960-4545
M: 214-960-4623
jake@shopcompanies.com
O: 214-960-4545
M: 214-960-4623
jake@shopcompanies.com
While we strive to provide the most accurate information, all listing information, and demographic data, is provided by third-parties. As such, MyEListing will not be responsible for the accuracy of the information. It is strongly recommended that you verify all information with the listing agent, and any relevant agencies, prior to making any decisions.