Retail Space
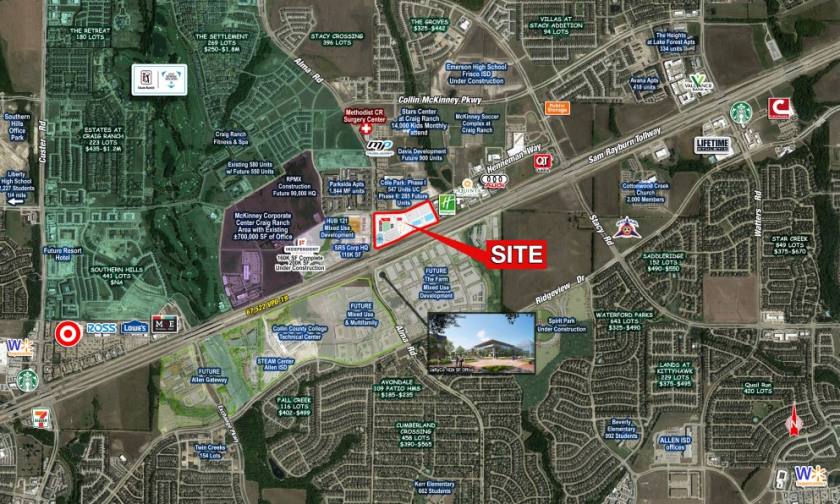
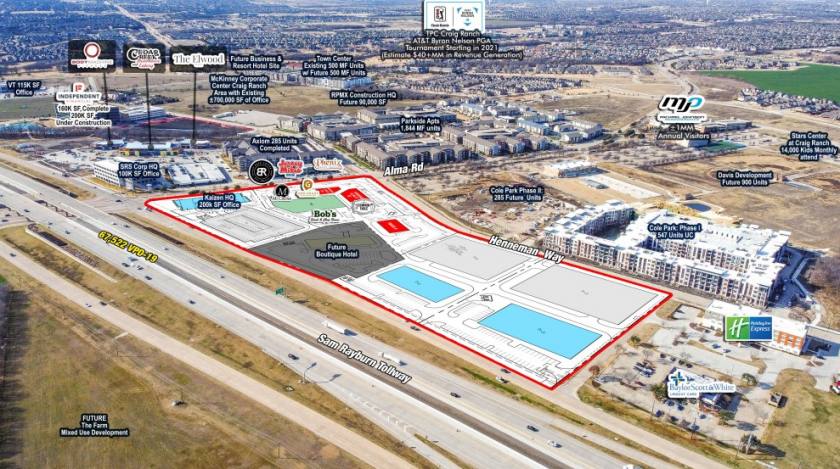
NEC of Hwy 121 and Alma Rd Allen, TX 75070
NEC of Hwy 121 and Alma Rd Allen, TX 75070
Details & Description
Property Highlights
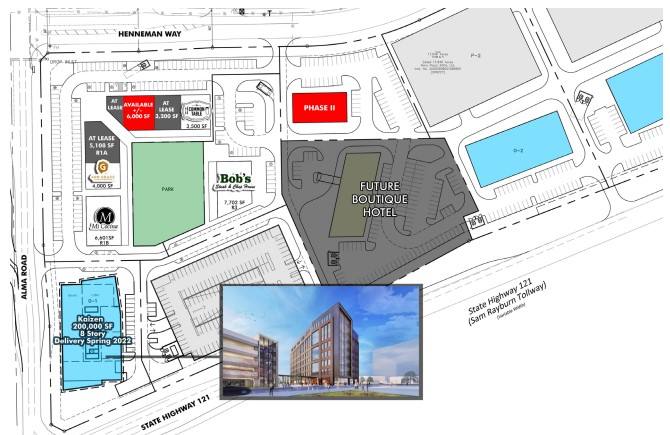
- • Phase I – Delivering FALL 2022
- • 6,000 SF Available
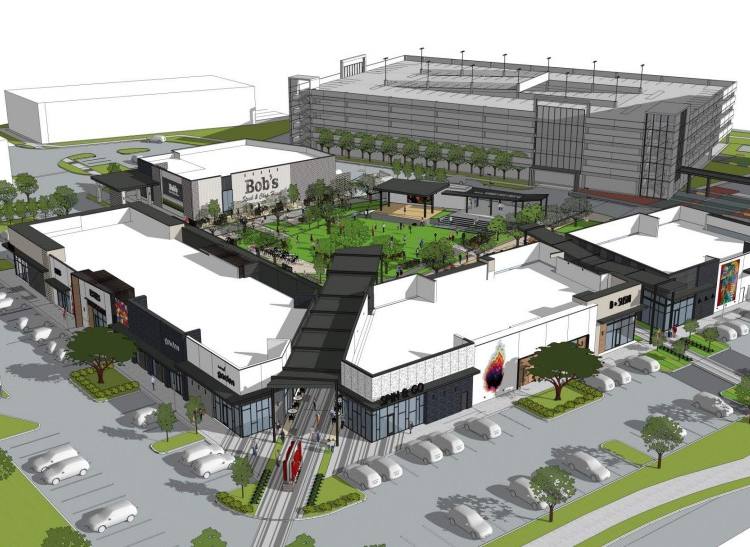
- • 35,000 SF Retail / Patio Restaurant
- • Parking Garage – 800 Spaces
- • Traffic Counts: N. Alma Rd.: 10,238 VPD-13
- • Traffic Counts: Sam Rayburn Tollway 146,176 VPD-15
Additional Photos


Listing Agents

Thomas Glendenning
O: 214-960-4528
M: 214-960-4545
thomas@shopcompanies.com
O: 214-960-4528
M: 214-960-4545
thomas@shopcompanies.com

Landry Kemp
SHOP Co
O: 214-960-4545
M: 214-398-2546
landry@shopcompanies.com
SHOP Co
O: 214-960-4545
M: 214-398-2546
landry@shopcompanies.com
While we strive to provide the most accurate information, all listing information, and demographic data, is provided by third-parties. As such, MyEListing will not be responsible for the accuracy of the information. It is strongly recommended that you verify all information with the listing agent, and any relevant agencies, prior to making any decisions.