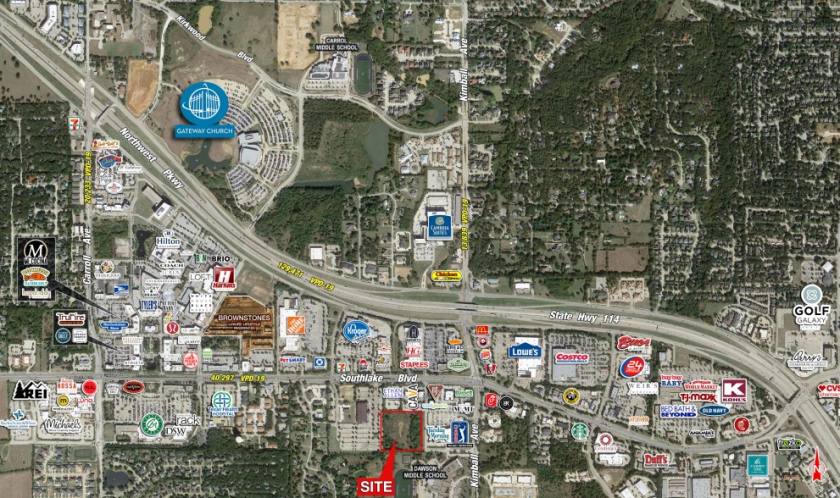
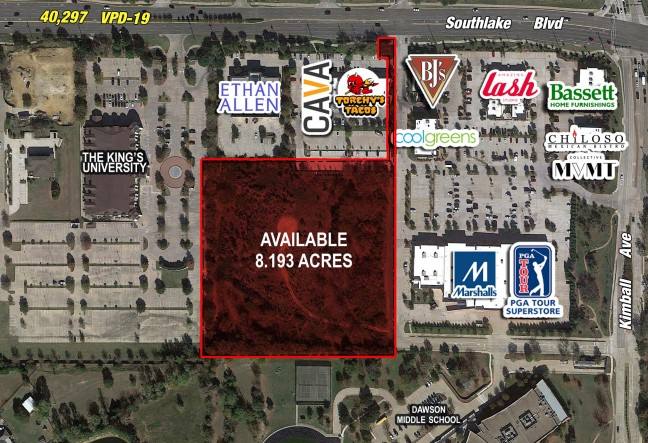
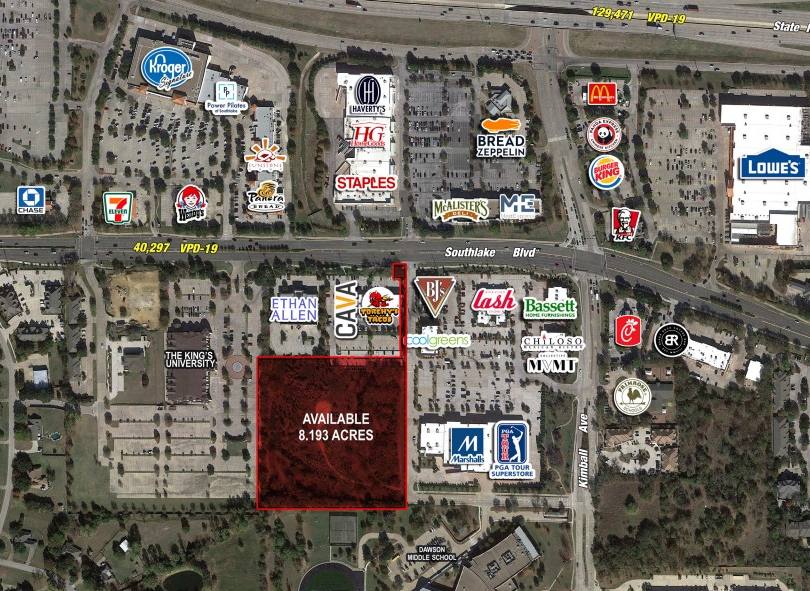
1-Mile | 3-Miles | 5-Miles | ||
---|---|---|---|---|
Total Population | 4,753 | 57,997 | 127,865 | |
Population Median Age | 35 | 38 | 39 | |
Population by Age | 0-9 Yrs | 703 (14%) | 7742 (13%) | 15837 (12%) |
10-19 Yrs | 857 (18%) | 8966 (15%) | 19552 (15%) | |
20-29 Yrs | 517 (10%) | 5709 (9%) | 12763 (9%) | |
30-39 Yrs | 455 (9%) | 6205 (10%) | 13416 (10%) | |
40-49 Yrs | 702 (14%) | 8736 (15%) | 19177 (14%) | |
50-59 Yrs | 839 (17%) | 9832 (16%) | 22141 (17%) | |
60-69 Yrs | 456 (9%) | 6638 (11%) | 15081 (11%) | |
70+ Yrs | 223 (4%) | 4169 (7%) | 9899 (7%) | |
Median HH Income | $155,908 | $115,997 | $131,443 | |
Total Household Income | < 24K | 104 (6%) | 1423 (6%) | 2826 (6%) |
25-49K | 146 (9%) | 2434 (11%) | 4580 (10%) | |
50-74K | 233 (15%) | 3036 (14%) | 5595 (12%) | |
75-99K | 153 (9%) | 2203 (10%) | 4573 (10%) | |
100-199K | 296 (19%) | 5458 (26%) | 14322 (31%) | |
200K+ | 606 (39%) | 5927 (28%) | 13540 (29%) | |
Highest Education Level | No Diploma | 101 | 2313 | 3712 |
Diploma or GED | 338 | 5350 | 10846 | |
Some College | 492 | 6953 | 15734 | |
Assoc. Degree | 123 | 2210 | 5568 | |
Bachelors Degree | 1223 | 14360 | 32366 | |
Higher Degree | 639 | 7262 | 18284 | |
Total Housing Units | 1,571 | 21,280 | 47,174 | |
--Owner-Occupied | 1,144 | 14,347 | 33,186 | |
--Renter-Occupied | 393 | 6,135 | 12,250 | |
Owner-Occupied Values | < 100K | 76 | 654 | 1209 |
100-199K | 37 | 605 | 1277 | |
200-299K | 67 | 2313 | 4028 | |
300-399K | 115 | 2473 | 5850 | |
400-499K | 104 | 1721 | 5457 | |
500K+ | 745 | 6581 | 15364 | |
Total Working Age Population | 3,554 | 44,450 | 99,105 | |
In Work Force | 2,267 | 31,511 | 69,624 | |
Not In Work Force | 1,288 | 12,938 | 29,481 | |
Workforce Employed | 2,221 | 30,201 | 66,708 | |
Workforce Unemployed | 46 | 1,310 | 2,892 | |
Civlian Workforce | 2,267 | 31,511 | 69,600 | |
Military Workforce | 0 | 0 | 24 | |
Total Households | 1,537 | 20,481 | 45,436 | |
Family Households | 1,260 | 15,170 | 34,407 | |
Non-Family Households | 278 | 5,311 | 11,029 | |
Married Couple | 993 | 12,864 | 29,939 | |
Other Family | 267 | 2,306 | 4,469 | |
Married w/Child | 580 | 6,065 | 13,477 | |
Single Male w/Child | 47 | 500 | 815 | |
Single Female w/Child | 77 | 711 | 1,405 |
Population Change Last Two Decades - Plus Projection
2000 | % | 2010 | % | 2020 | % | 2030 | |
---|---|---|---|---|---|---|---|
Texas | 20,851,820 | +21 | 25,145,561 | +18 | 29,677,668 | +18 | 34,894,452 |
Tarrant County | 1,446,219 | +25 | 1,809,034 | +19 | 2,143,755 | +17 | 2,507,170 |
Denton County | 432,976 | +53 | 662,614 | +36 | 897,953 | +37 | 1,234,110 |
Total Working Age Population:
Total Households:
Total Working Age Population:
Total Households:
Total Working Age Population:
Total Households: