Commercial Land
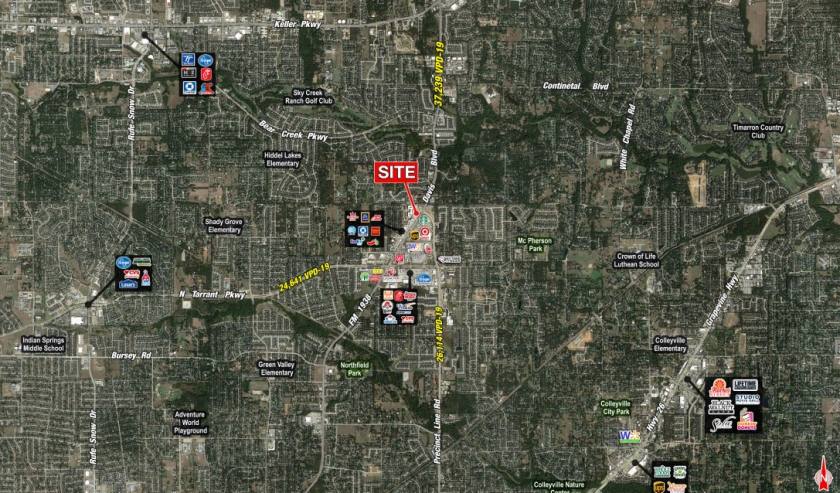
NWC of Davis Blvd and Precinct Line Rd North Richland Hills, TX 76182
NWC of Davis Blvd and Precinct Line Rd North Richland Hills, TX 76182
Details & Description
Property Highlights
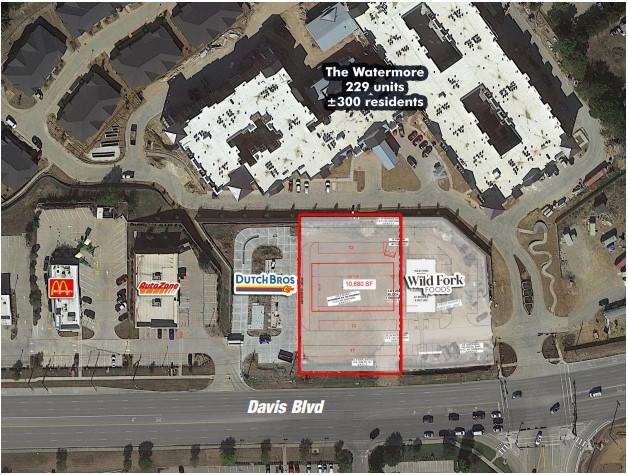
- • Future Strip
- • Drive Thru Available
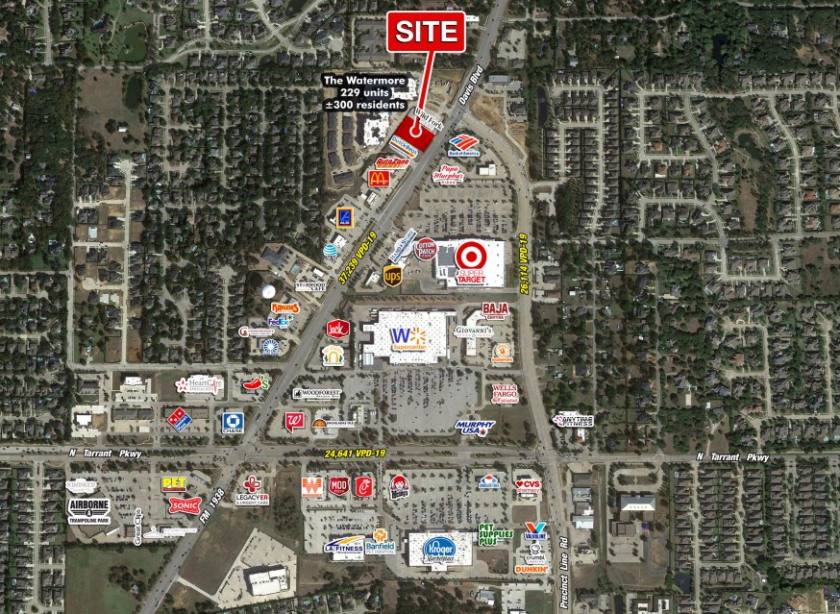
- • Traffic Counts: Davis Blvd: 37,239 VPD-19
- • Traffic Counts: Precinct Line: 26,114VPD-19
Listing Agents

Thomas Glendenning
O: 214-960-4528
M: 214-960-4545
thomas@shopcompanies.com
O: 214-960-4528
M: 214-960-4545
thomas@shopcompanies.com

Jake Sherrington
O: 214-960-4545
M: 214-960-4623
jake@shopcompanies.com
O: 214-960-4545
M: 214-960-4623
jake@shopcompanies.com
While we strive to provide the most accurate information, all listing information, and demographic data, is provided by third-parties. As such, MyEListing will not be responsible for the accuracy of the information. It is strongly recommended that you verify all information with the listing agent, and any relevant agencies, prior to making any decisions.