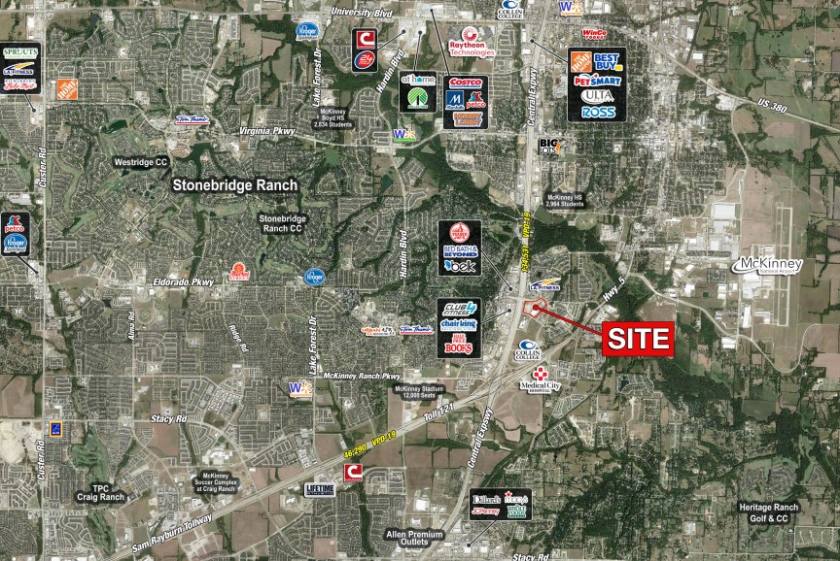
Retail Space
3001 Central Expressway McKinney, TX 75070
3001 Central Expressway McKinney, TX 75070
Details & Description
Property Highlights
- • 1.42 acre pad Available (61,855 SF)
- • Traffic Counts: Eldorado Pkwy: 25,598 VPD-19
- • Traffic Counts: US 75: 134,531 VPD-19
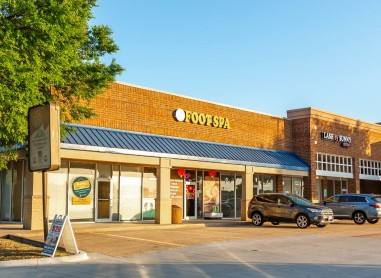
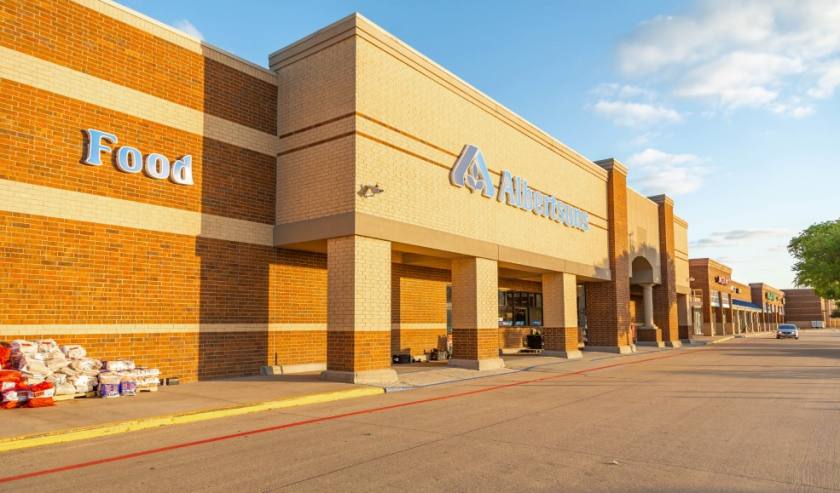
Additional Photos


Listing Agents

Daniel Frid
O: 214-960-4545
M: 214-501-5108
dfrid@shopcompanies.com
O: 214-960-4545
M: 214-501-5108
dfrid@shopcompanies.com

Jack Weir
O: 214-960-4545
M: 214-935-5634
jack@shopcompanies.com
O: 214-960-4545
M: 214-935-5634
jack@shopcompanies.com
While we strive to provide the most accurate information, all listing information, and demographic data, is provided by third-parties. As such, MyEListing will not be responsible for the accuracy of the information. It is strongly recommended that you verify all information with the listing agent, and any relevant agencies, prior to making any decisions.


