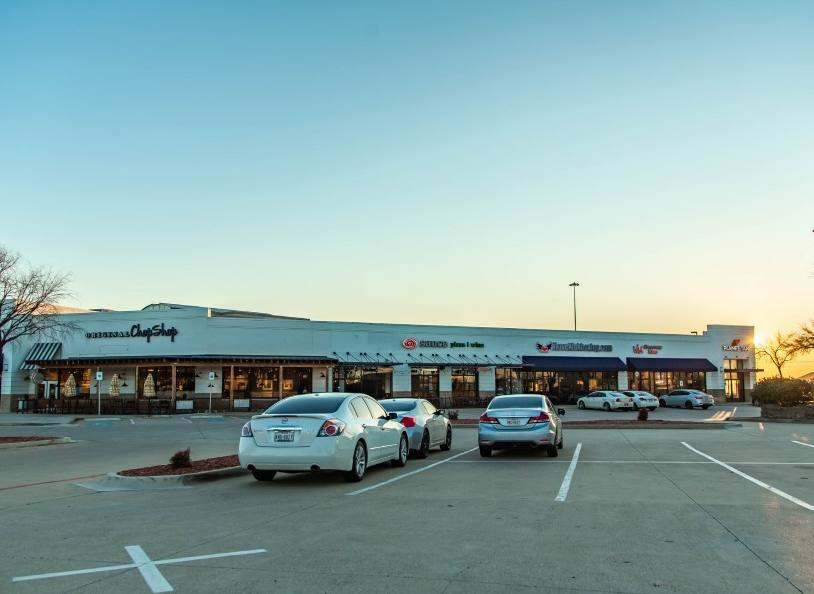
Retail Space
7300 North MacArthur Boulevard Irving, TX 75063
7300 North MacArthur Boulevard Irving, TX 75063
Details & Description
Property Highlights
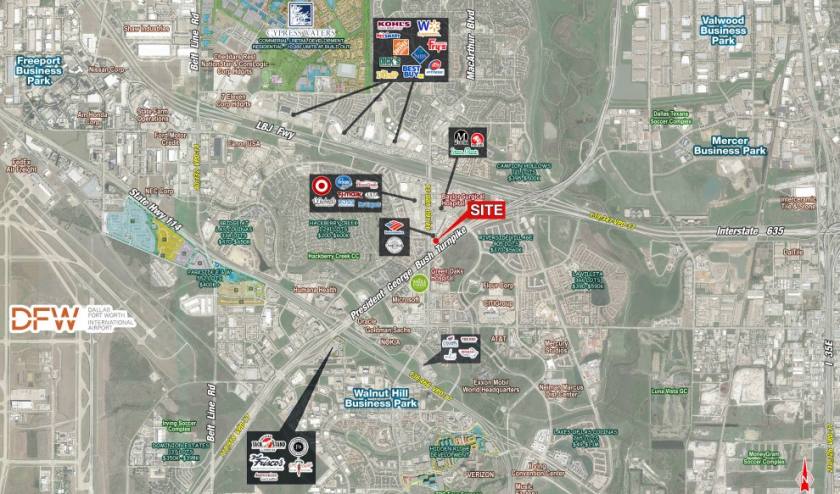
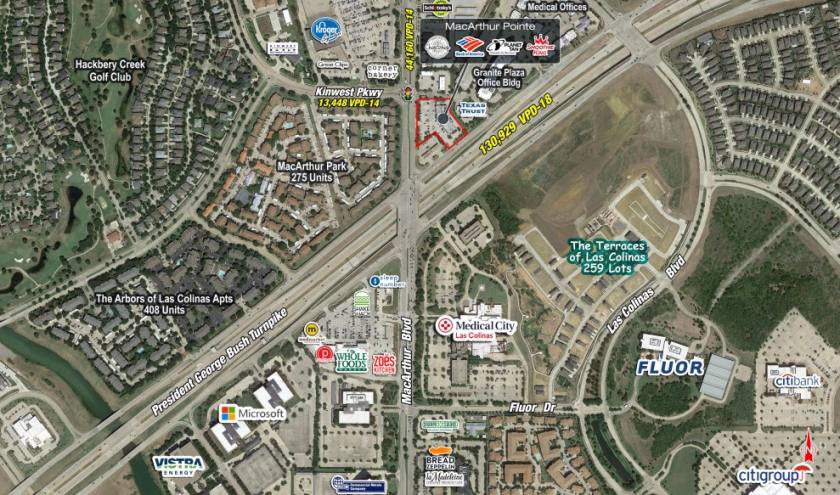
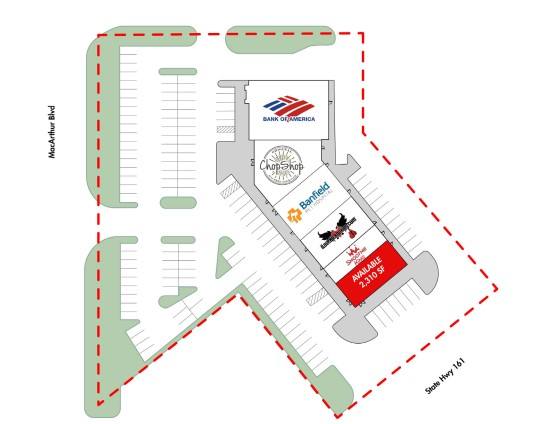
• Traffic Counts: Hwy 161: 67,264 VPD
• Belt Line Rd: 50,605 VPD
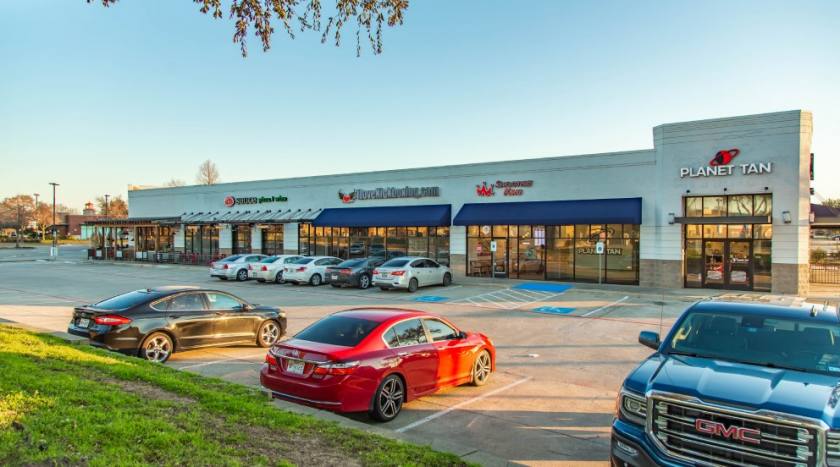
Additional Photos
Listing Agents

Daniel Frid
O: 214-960-4545
M: 214-501-5108
dfrid@shopcompanies.com
O: 214-960-4545
M: 214-501-5108
dfrid@shopcompanies.com

David Sacher
O: 214-960-4545
M: 214-960-2804
david@shopcompanies.com
O: 214-960-4545
M: 214-960-2804
david@shopcompanies.com
While we strive to provide the most accurate information, all listing information, and demographic data, is provided by third-parties. As such, MyEListing will not be responsible for the accuracy of the information. It is strongly recommended that you verify all information with the listing agent, and any relevant agencies, prior to making any decisions.


