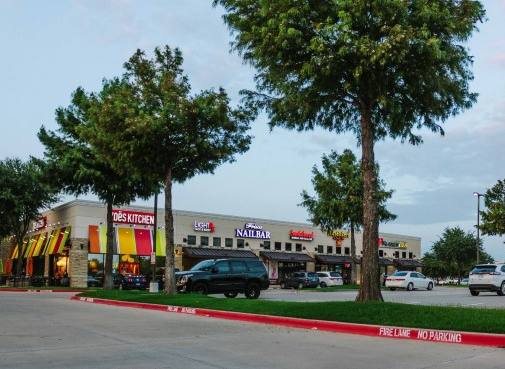
Retail Space
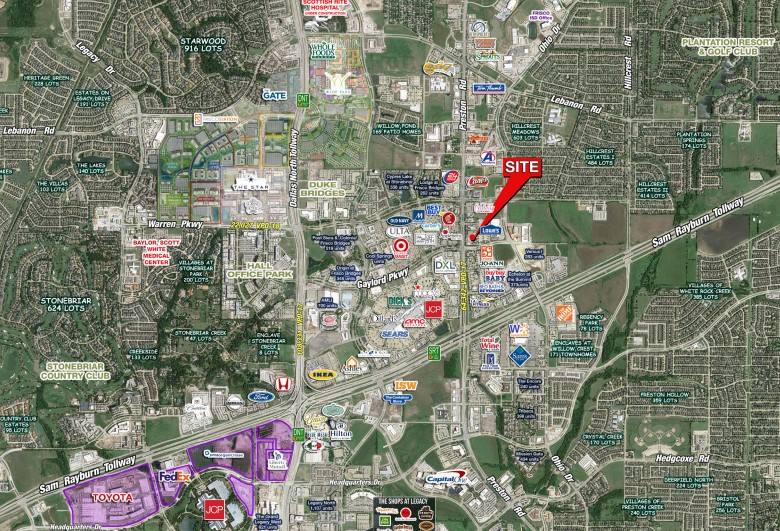
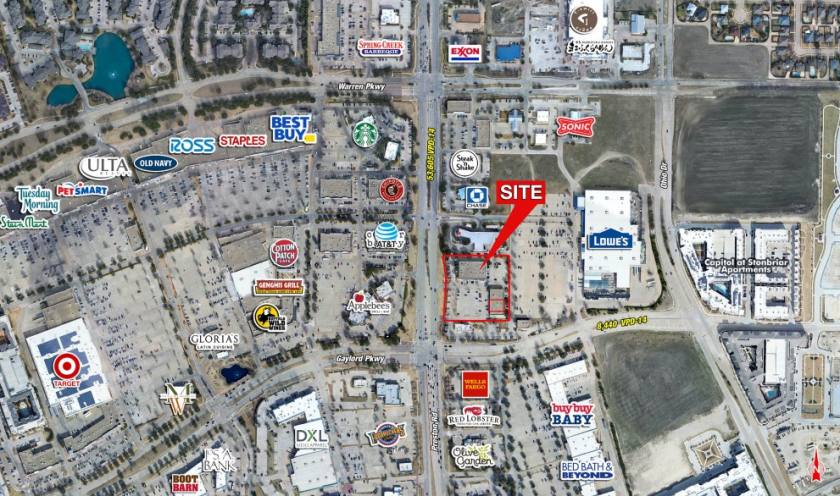
3184 - 3188 Preston Rd Frisco, TX 75034
3184 - 3188 Preston Rd Frisco, TX 75034
Details & Description
Property Highlights
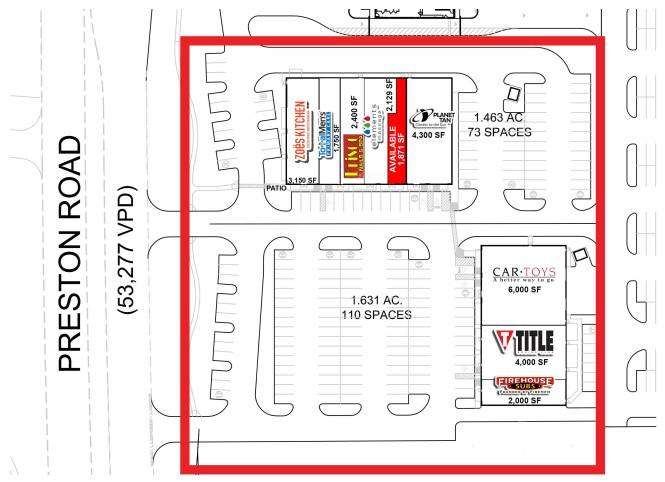
- • 1,871 SF Available
- • 2nd generation restaurant
- • Traffic Counts: Preston Rd: 53,720 VPD
- • Traffic Counts: Gaylord Pkwy: 16,733 VPD
- • Traffic Counts: Ohio Dr: 5,532 VPD
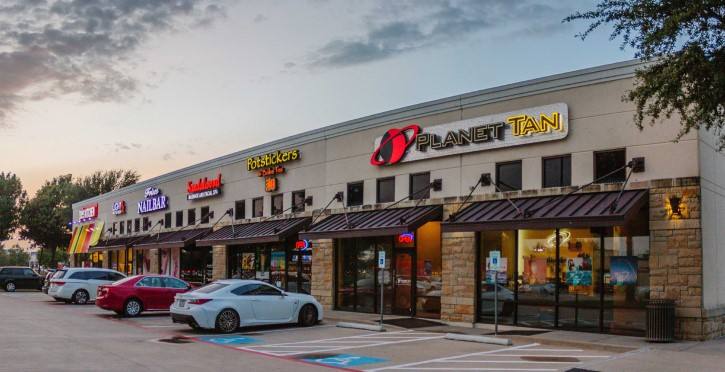
Additional Photos
Listing Agents

Daniel Frid
O: 214-960-4545
M: 214-501-5108
dfrid@shopcompanies.com
O: 214-960-4545
M: 214-501-5108
dfrid@shopcompanies.com
While we strive to provide the most accurate information, all listing information, and demographic data, is provided by third-parties. As such, MyEListing will not be responsible for the accuracy of the information. It is strongly recommended that you verify all information with the listing agent, and any relevant agencies, prior to making any decisions.


