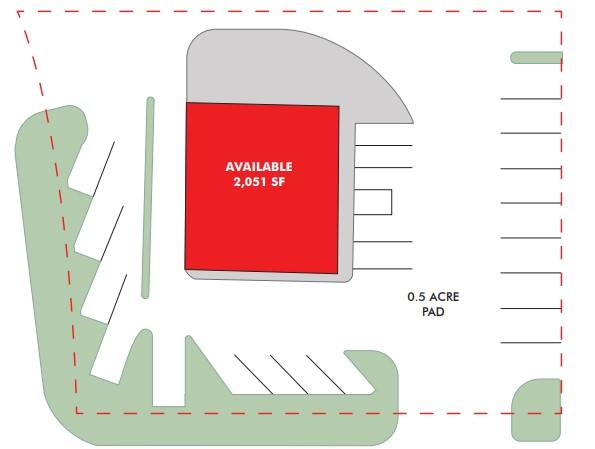
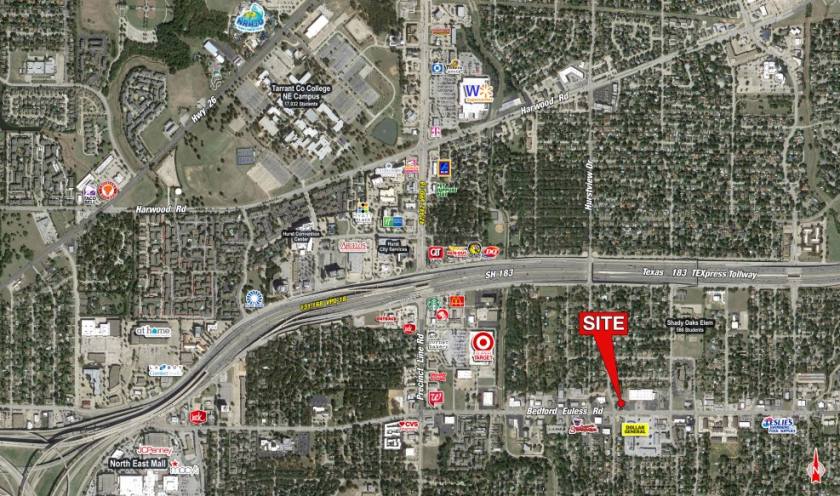
1-Mile | 3-Miles | 5-Miles | ||
---|---|---|---|---|
Total Population | 12,544 | 112,743 | 247,042 | |
Population Median Age | 39 | 39 | 39 | |
Population by Age | 0-9 Yrs | 1784 (14%) | 14050 (12%) | 31453 (12%) |
10-19 Yrs | 1468 (11%) | 14622 (12%) | 32124 (13%) | |
20-29 Yrs | 1479 (11%) | 15457 (13%) | 31614 (12%) | |
30-39 Yrs | 1677 (13%) | 15326 (13%) | 33068 (13%) | |
40-49 Yrs | 1683 (13%) | 14358 (12%) | 32003 (12%) | |
50-59 Yrs | 1540 (12%) | 13426 (11%) | 32104 (12%) | |
60-69 Yrs | 1240 (9%) | 13021 (11%) | 30316 (12%) | |
70+ Yrs | 1673 (13%) | 12484 (11%) | 24360 (9%) | |
Median HH Income | $60,108 | $67,269 | $74,532 | |
Total Household Income | < 24K | 646 (13%) | 4675 (10%) | 10186 (11%) |
25-49K | 1299 (27%) | 10671 (24%) | 19336 (20%) | |
50-74K | 905 (19%) | 8705 (20%) | 16837 (18%) | |
75-99K | 685 (14%) | 5800 (13%) | 13148 (14%) | |
100-199K | 1023 (21%) | 10794 (25%) | 25083 (27%) | |
200K+ | 108 (2%) | 2389 (5%) | 7525 (8%) | |
Highest Education Level | No Diploma | 660 | 6758 | 14323 |
Diploma or GED | 2440 | 17321 | 36990 | |
Some College | 2414 | 20453 | 43135 | |
Assoc. Degree | 721 | 7330 | 15190 | |
Bachelors Degree | 1713 | 17410 | 40531 | |
Higher Degree | 747 | 7908 | 19068 | |
Total Housing Units | 4,985 | 46,226 | 97,736 | |
--Owner-Occupied | 2,709 | 24,101 | 58,107 | |
--Renter-Occupied | 1,957 | 18,935 | 34,009 | |
Owner-Occupied Values | < 100K | 215 | 1522 | 4077 |
100-199K | 1315 | 9064 | 19195 | |
200-299K | 987 | 8278 | 18264 | |
300-399K | 116 | 3347 | 7493 | |
400-499K | 53 | 1288 | 4597 | |
500K+ | 22 | 603 | 4480 | |
Total Working Age Population | 9,879 | 88,885 | 194,659 | |
In Work Force | 6,448 | 60,546 | 134,080 | |
Not In Work Force | 3,430 | 28,339 | 60,579 | |
Workforce Employed | 6,230 | 58,353 | 128,939 | |
Workforce Unemployed | 218 | 2,192 | 5,068 | |
Civlian Workforce | 6,448 | 60,545 | 134,007 | |
Military Workforce | 0 | 1 | 73 | |
Total Households | 4,666 | 43,035 | 92,116 | |
Family Households | 3,069 | 28,046 | 63,534 | |
Non-Family Households | 1,596 | 14,989 | 28,582 | |
Married Couple | 2,178 | 20,509 | 47,564 | |
Other Family | 892 | 7,538 | 15,970 | |
Married w/Child | 798 | 8,068 | 18,427 | |
Single Male w/Child | 127 | 738 | 1,843 | |
Single Female w/Child | 454 | 3,514 | 6,582 |
Population Change Last Two Decades - Plus Projection
2000 | % | 2010 | % | 2020 | % | 2030 | |
---|---|---|---|---|---|---|---|
Texas | 20,851,820 | +21 | 25,145,561 | +18 | 29,677,668 | +18 | 34,894,452 |
Tarrant County | 1,446,219 | +25 | 1,809,034 | +19 | 2,143,755 | +17 | 2,507,170 |
Total Working Age Population:
Total Households:
Total Working Age Population:
Total Households:
Total Working Age Population:
Total Households: