Industrial Properties
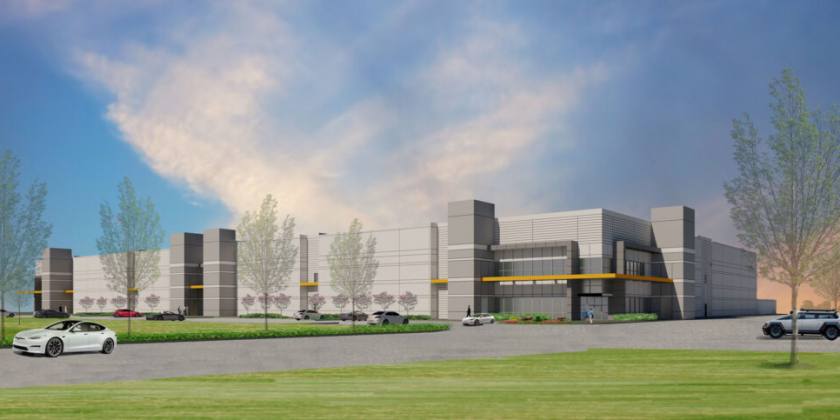
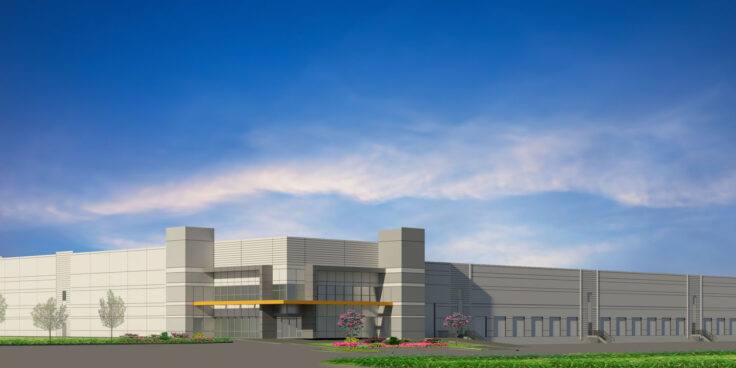
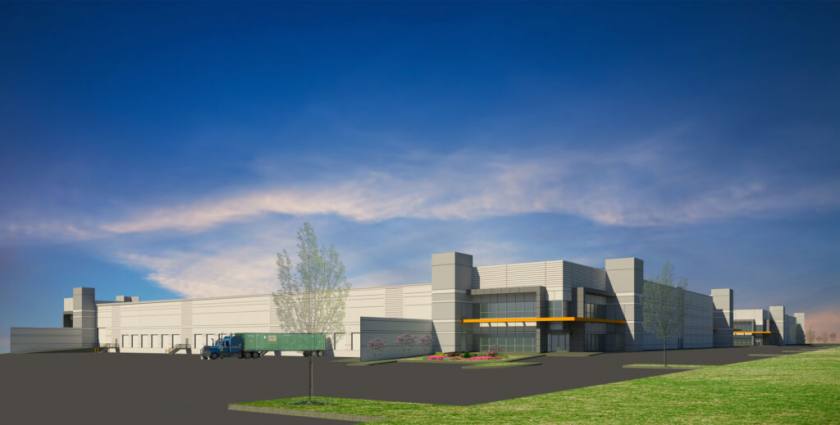
Crossroads Commercial Center Manor, TX 78653
Crossroads Commercial Center Manor, TX 78653

Details & Description
Property Highlights
- • Triple Freeport Zone 30+
- • Ft. Clear Heights
- • Larger Truck Courts
- • Custom Loading Door & Ramp Configurations
Additional Photos
Listing Agents

Andy Thomas
O: 512-538-0058
thomas@hpitx.com
O: 512-538-0058
thomas@hpitx.com

Davis Bass
O: 512-538-1030
bass@hpitx.com
O: 512-538-1030
bass@hpitx.com

D. Kent Lance
O: 512-538-0055
dklance@hpitx.com
O: 512-538-0055
dklance@hpitx.com
While we strive to provide the most accurate information, all listing information, and demographic data, is provided by third-parties. As such, MyEListing will not be responsible for the accuracy of the information. It is strongly recommended that you verify all information with the listing agent, and any relevant agencies, prior to making any decisions.


